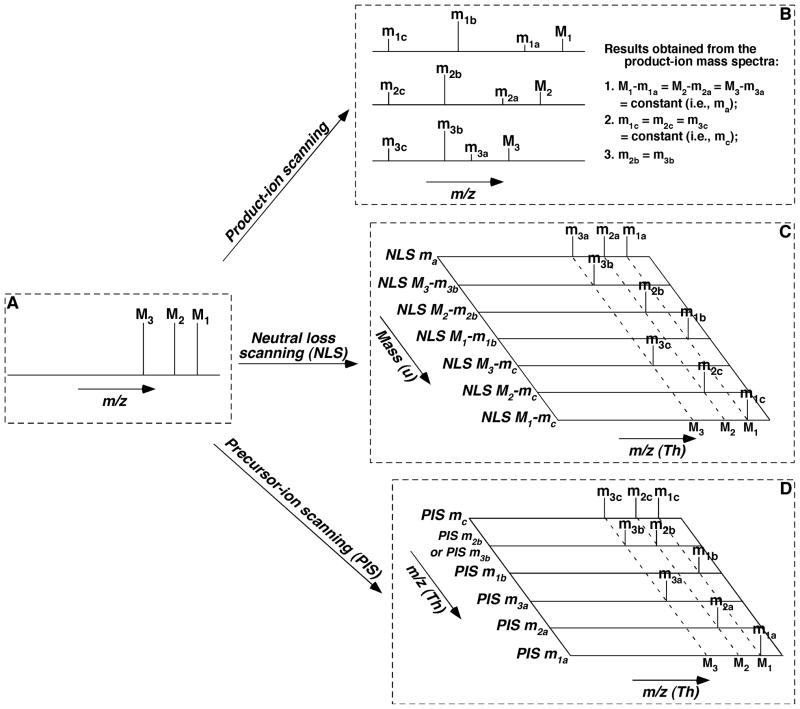
FIGURE 3.
Schematic illustration of the inter-relationship among the MS/MS techniques for the analysis of individual molecular species of a class of interest. We only illustrate the analysis of three species (M1, M2, and M3) of a class for simplicity, whereas there exist up to hundreds of individual molecular species within a class. We assume that this class of lipid species, similar to a class of phospholipids or sphingolipids possesses one common neutral-loss fragment with mass of ma (i.e., M1 − m1a = M2 − m2a = M3 − m3a = ma (a constant)), one common fragment ion at m/z mc (i.e., m1c = m2c = m3c = mc), and a specific ion to individual species at m/z m1b, m2b, and m3b, respectively, which might not be identical to each other. Specifically, the common neutral fragment and the common fragment ion both result from the head group of the class; the individual species-specific ions represent the fatty acyl moieties of the species; and thus the residual part of each individual species can be derived from these fragments in combination with the m/z of each molecule ion. Panel A shows a simplified full-mass scan; Panel B illustrates the product-ion analysis of these molecule ions; Panel C demonstrates the scanning of the individual neutral-loss fragment between a specific molecule ion and its individual fragment ion; and Panel D represents the scanning of each individual fragment ion. It should be emphasized that, although the analyses of fragments with either neutral-loss scanning (NLS) or precursor-ion scanning (PIS) are much more complicated than those in product-ion scanning in this simplified case, the analyses by NLS or PIS are much simpler than that with product-ion scanning in reality as discussed in the text.

