Figure 3.
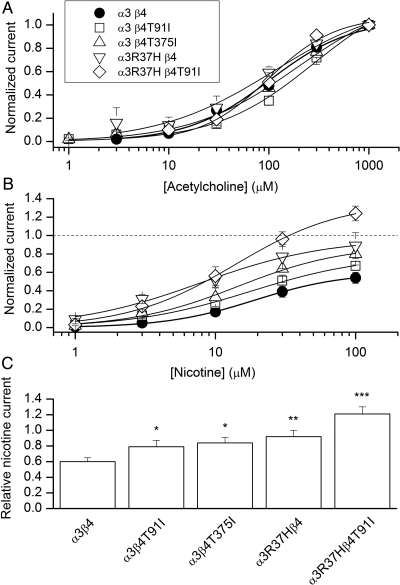
Functional effects of the mutations to the α3 and β4 subunits. (A) The ACh concentration–response curves were obtained by fitting the data recorded at 1–1000 μm ACh to the Hill equation. The data are normalized to 1 mm ACh. Each data point is mean ± SEM from 4 to 9 cells. The fitting results are given in Supplementary Material, Table S2. (B) The nicotine concentration–response curves were obtained by fitting the data recorded at 1–100 μm nicotine to the Hill equation. Each cell was additionally exposed to 1 mm ACh to which the nicotine responses are normalized. Each data point is mean ± SEM from 3 to 9 cells. (C) The relative nicotine current is calculated as the ratio of the peak responses to 100 μm nicotine and 1 mm ACh from the same cell. The data are mean ± SEM from 6 to 13 cells. Statistical significance was assessed by t-test and shows comparison to the normal α3β4 receptor. *P < 0.05; **P = 0.003; ***P = 2 × 10⁻⁶.

