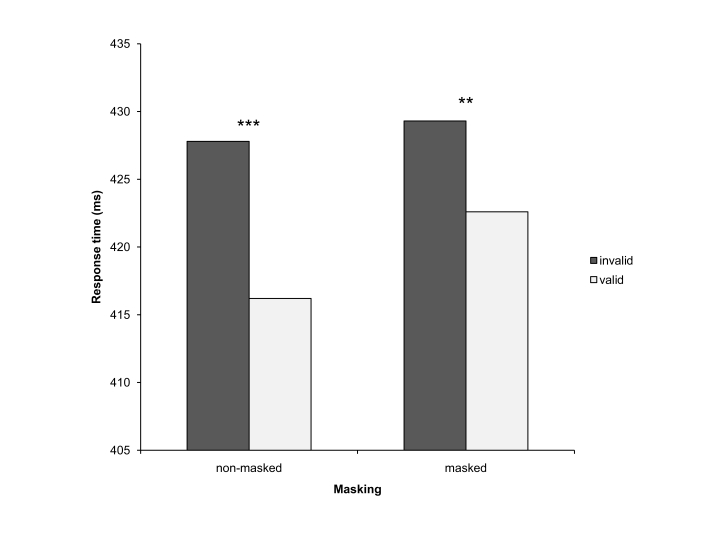
Figure 3.
Response times (RTs) in Experiment 2 (overall cue validity 80%). The dark grey bars represent RTs in trials with invalid cues, the light grey bars represent RTs in trials with valid cues. The bars in the left column depict RTs with non-masked cues, and the bars in the right column depict RTs with masked cues. ** indicates effects with p< .01. *** indicates effects with p< .001.

