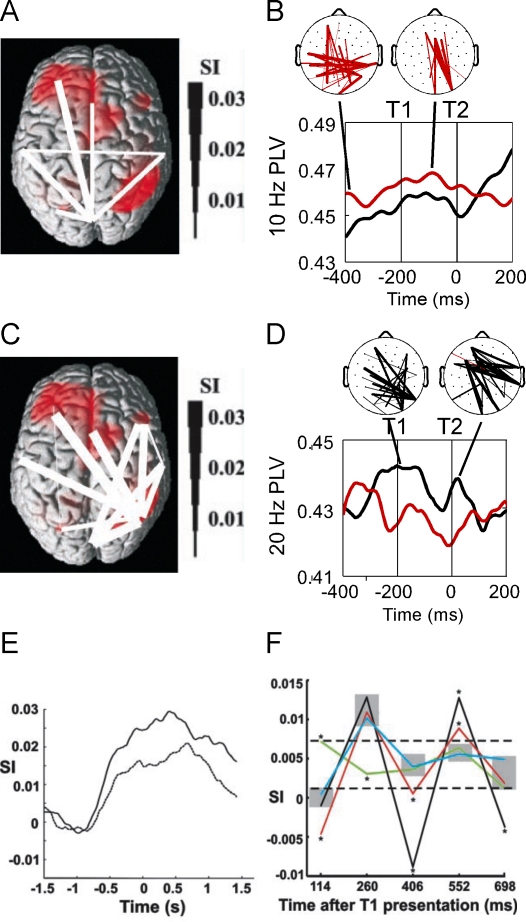
Figure 3.
Stimulus (a, b) and target (c-f) related activity in the alpha and beta frequency bands.
(a) Stimulus-related network identified by Gross, Schmitz, Schnitzler, Kessler, Shapiro, Hommel, and Schnitzler (2004). The network was found to primarily link occipital to left frontal areas. The degree of beta band synchronization of the stimulus-related connections was modulated at the stimulus presentation frequency (about 6.8 Hz).
(b) Long-range synchronization as observed by Kranczioch, Debener, Maye, and Engel (2007). Synchronization at the stimulus presentation frequency of 10 Hz was increased for AB trials (red) as compared to no-AB trials (black), likely reflecting differences in distractor processing. As indicated by the topographic plots, differences in long-range synchronization were mainly due to higher synchronization between parieto-occipital and (left) frontal areas in AB trials. Note the similarity between the stimulus-related network in (a) and the pre-T1 activity of the distractor-related network in (b).
(c)Target-related network identified by Gross et al. (2004). The strongest connections of the network were found between right posterior parietal regions and cingulum and left temporal and frontal regions. For target-related connections, synchronization in the beta band was modulated mainly by targets.
(d) Long-range synchronization in the beta band as observed by Kranczioch et al. (2007). Synchronization was increased for no-AB (black) as compared to AB (red) trials, in particular between right temporo-parietal and left frontal and temporal electrode sites. Note the similarity between topographical patterns in (c) and (d).
(e) Mean synchronization index (SI) for the target-related connections shown in (c). The no-AB condition (upper, solid line) is characterised by a stronger beta band synchronization than the AB condition (lower, dotted line). Conditions begin to differ clearly before T1 presentation. Zero corresponds to the presentation of T1.
(f) Network synchronization to T1 and T2 (positive peaks at 260 and 552 ms after T1 presentation) and network de-synchronization to the distractors before and after the targets (negative peaks at 114, 406, and 698 ms). In AB trials (red line), both the T2-related synchronization and the distractor-related desynchronization are significantly attenuated. The black line corresponds to no-AB trials, the blue line to target related activation, and the green line to distractor related activity. Sections (a), (c), (e), and (f) adapted from “Modulation of Long-Range Neural Synchrony Reflects Temporal Limitations of Visual Attention in Humans” by J. Gross, F. Schmitz, I. Schnitzler, K. Kessler, K. Shapiro, B. Hommel, and A. Schnitzler, 2004, Proceedings of the National Academy of Sciences of the United States of America, 101(35), pp. 13052, 13053. Copyright 2004 by the National Academy of Sciences, U.S.A. Sections (b) and (d) adapted from “Temporal dynamics of access to consciousness in the attentional blink” by C. Kranczioch, S. Debener, A. Maye, and A. Engel, 2007), NeuroImage, 37(3), p. 953.

