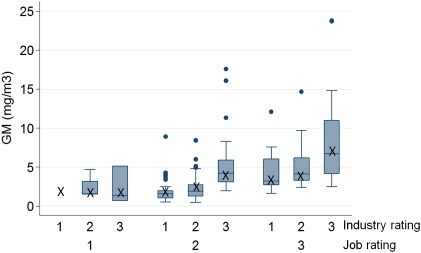
Fig. 3.
Distribution of the predicted benzene exposure for job/industry groups with the same intensity ratings for the year 1980. The box shows the interquartile range (IQR) when the empirical Bayes terms were used to predict benzene concentration. The line within the box shows the median estimate, the whiskers show 1.5 × IQR, and the dots show the outliers. X shows the predicted concentration when the empirical Bayes terms were not used. The figure includes only the subset of job/industry groups that met the criteria for assigning a non-zero benzene exposure based on having a high exposure probability rating (>50% of workers exposed; n = 370).

