
Figure 1.
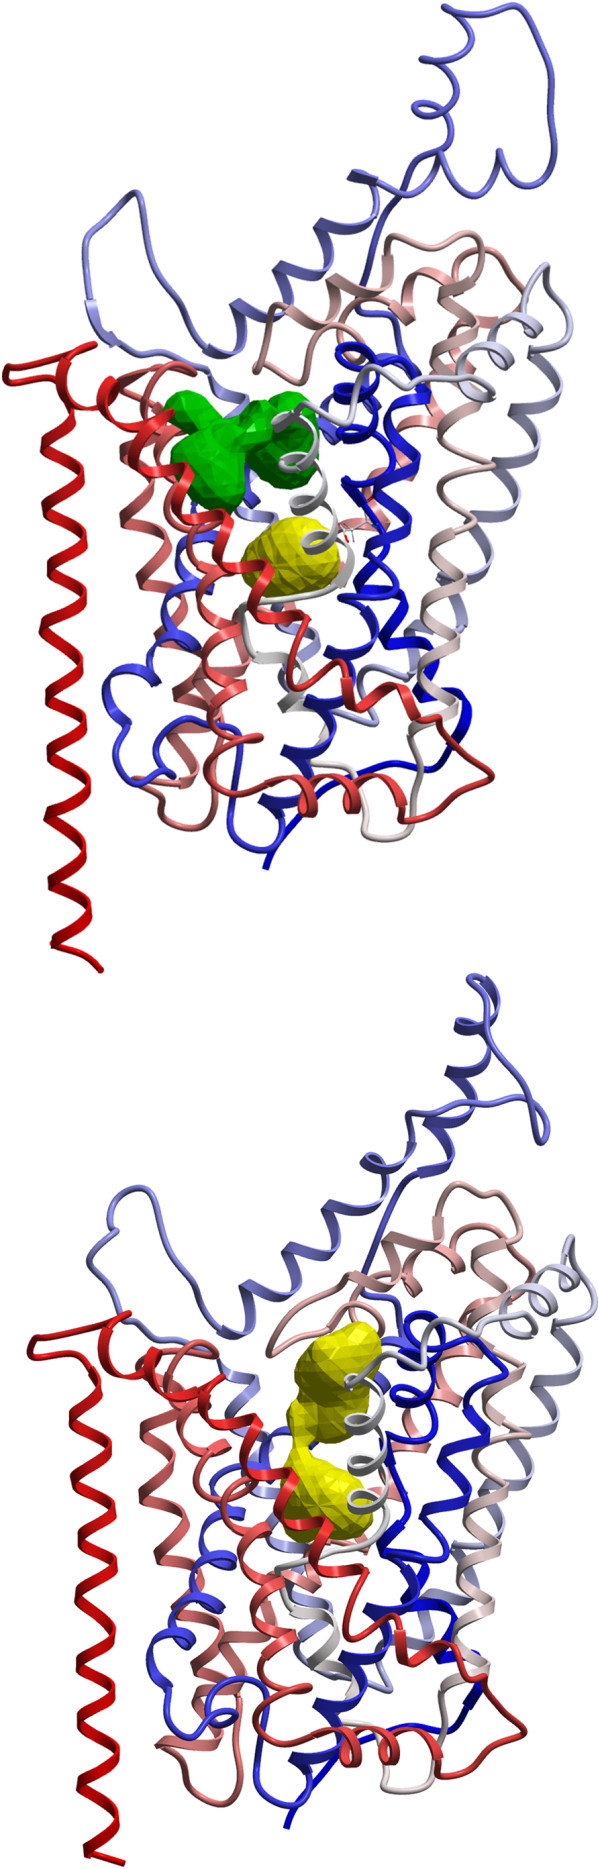
Backbone Cα-traces of occluded DAT model [10](A) and Open-to-out DAT model (B) viewed in the membrane plane cytoplasm downwards. Binding sites as detected by ICM PocketFinder are displayed in yellow (S1) and green (S2) (A); and in yellow (B). Coloring of the C-alpha traces of the model is blue via white to red from N-terminal to C-terminal.