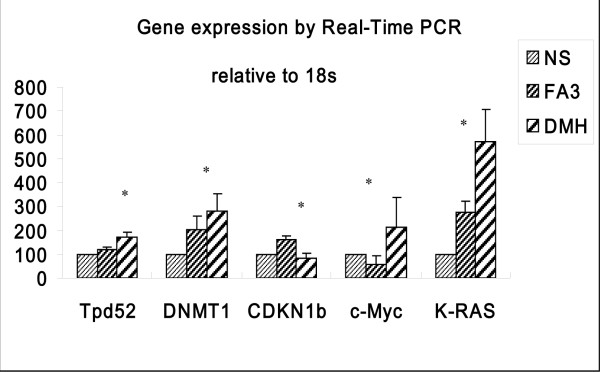
Figure 3.
Differentially expressed genes validated by real-time polymerase chain reaction (q-PCR). We used 18s rRNA as an internal control. Relative mRNA expression was calculated according to the 2-ΔΔT method. Data are expressed as the mean ± SD of 10 samples. The significance of the varieties between the average values of groups DMH and FA3 was analyzed through student's t-t test. (*: P < 0.05, between FA3 and DMH group)

