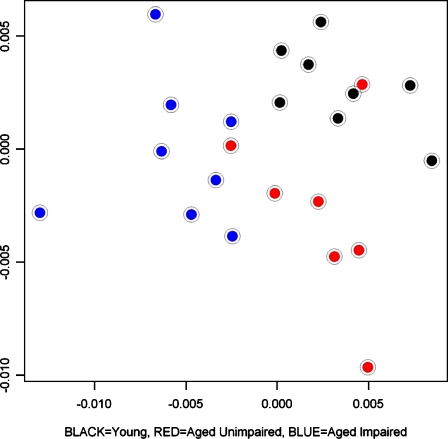
Figure 5.
Multidimensional scaling plot of gene profiles in the CA3 region for young rats (black dots, N=7), aged unimpaired rats (red dots, N=7) and aged impaired rats (blue dots, N=8). In order to assess global similarity between CA3 RNA expression profiles, we calculated a Pearson’s correlation coefficient (r) for all pair-wise sample comparisons. This was done using gene expression metrics derived from G+C content-robust microchip average (GC-RMA) analysis (Qin et al. 2006) of Affymetrix microarrays (230-2.0 chips). A multidimensional scaling algorithm (MDS, using a distance metric of 1-r for each pair-wise comparison) was used to represent each CA3 RNA sample in two-dimentional space. Hence, each point in this plot represents the Affymetrix microarray data from a single CA3 RNA sample corresponding to an individual rat, and proximity reflects global similarity of gene expression profiles across samples/rats. The plot reveals a fairly clear separation of the three groups of animals studied, indicative of greater similarity in expression profiles within each group, and dissimilarity across the groups. The gene profiles of the aged impaired rats (blue dots) are entirely segregated from those of the young rats (black dots). Although the aged unimpaired rats performed on a par with young rats, there is little overlap between their gene expression profiles (red dots) and those of either young rats or aged cohorts with impaired cognition

