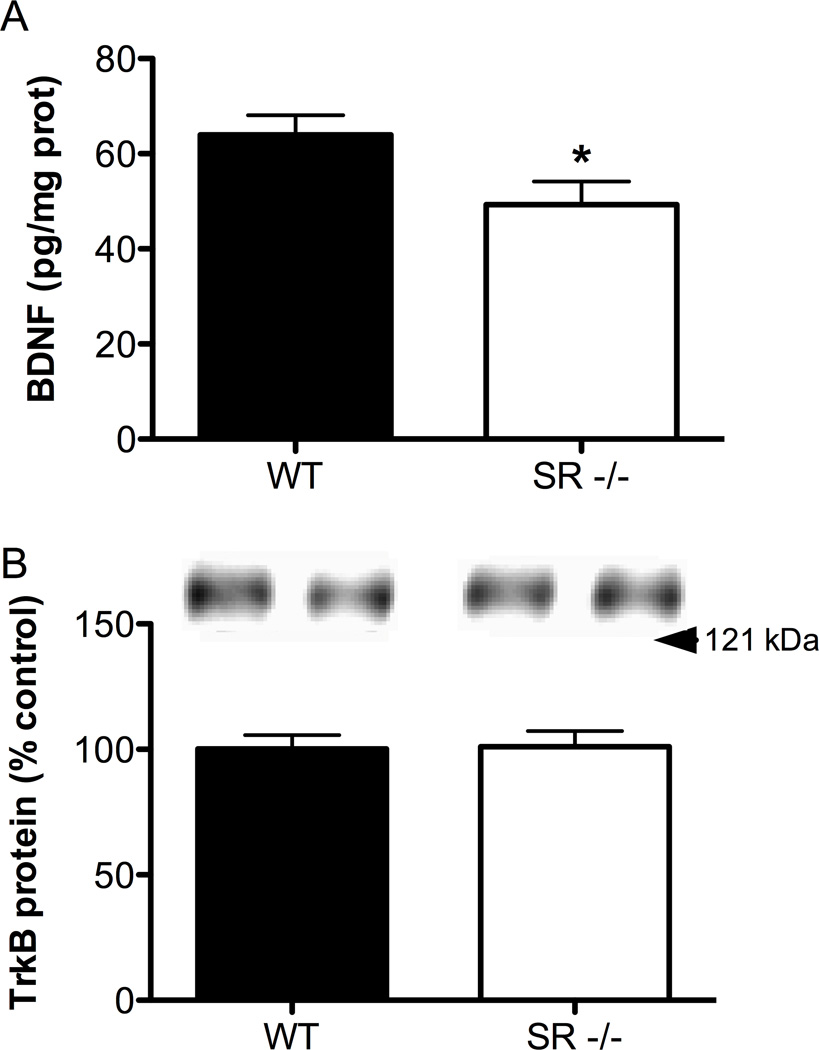
Fig. 6.
BDNF protein levels are reduced in the S1 cortex of SR−/− mice, without alterations in TrkB levels. (A), BNDF protein levels were measured in S1 cortex of wild-type (WT; n = 7; black bars) and SR−/− (n = 6; white bars) mice using ELISA. Values are expressed as pg of BDNF / mg of protein. (B), TrkB protein levels were measured using Western blot from the same samples used to measure BDNF. Values are expressed as the optical density (OD) normalized to WT values (% control). Asterisk (*) indicates significant difference from the WT group (p < 0.05). All values represent the mean ± SEM.

