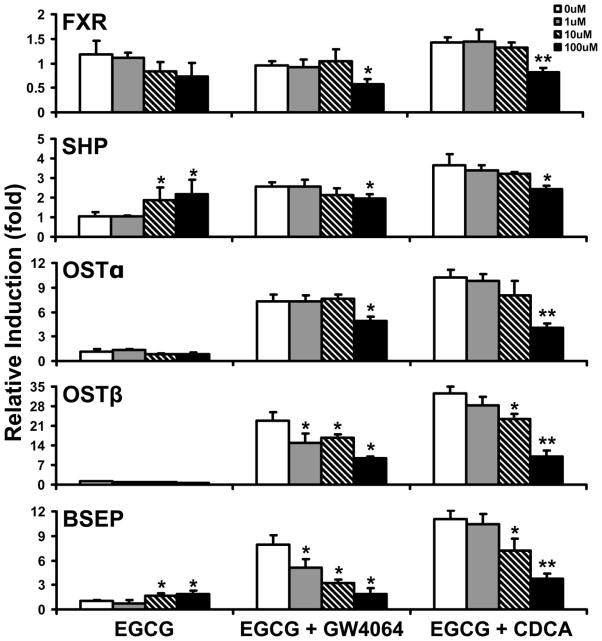
Figure 5. Effects of EGCG on FXR target gene induction by GW4064 and CDCA in HepG2 cells.
HepG2 cells were treated with 500 nM GW4064 or 100 μM CDCA for 24 hours in the absence or presence of increasing concentrations of EGCG (1, 10 and 100 μM). The mRNA levels of FXR, SHP, OSTα, OSTβ and BSEP were determined by Q-PCR with n=3 per group. The results for each gene were normalized to vehicle control. An asterisk represents P < 0.05 between the treatment and no EGCG treatment group. Double asterisks indicate P < 0.01 between the combined treatment and no EGCG treatment group.

