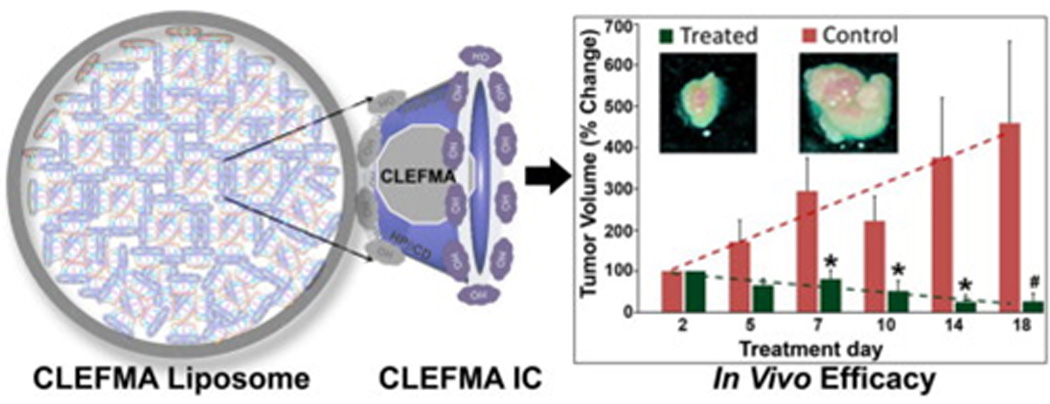
Figure 4.

Schematic representation of 4-[3,5-bis(2-chlorobenzylidene-4-oxo-piperidine-1-yl)-4-oxo-2-butenoic acid] (CLEFMA) liposomes obtained by a drug-in CD-in liposome method, detailing tumor volume control with liposomal CLEFMA treatment. Insets show representative pictures of excised tumors upon necropsy. The dashed lines are the trend lines of the plotted data. The data are presented as the mean ± SEM of results from experiments on n = 4 (treatment) and n = 3 (control) rats.Reprinted, with permission, from [99].
