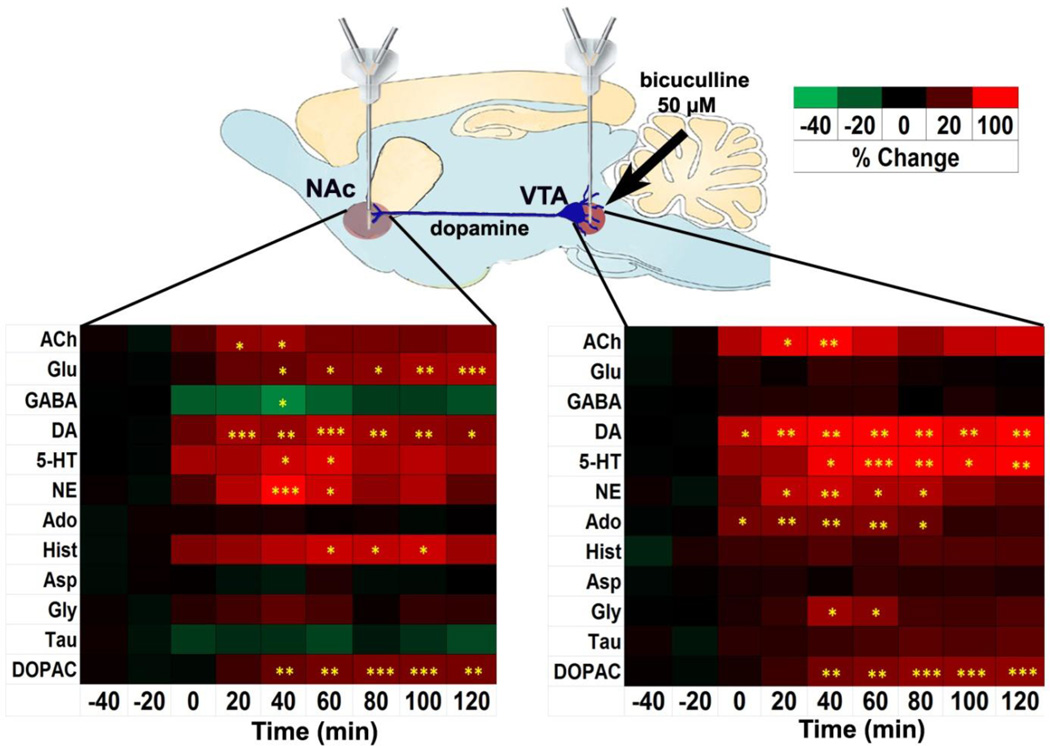
Figure 4.
Dual probe microdialysis of the mesolimbic pathway. Bicuculline (50 µM) was perfused in the VTA while monitoring neurotransmitters both locally and distally in the NAc. Heat map shows all changes of neurochemicals monitored where colors correlate with changes expressed as percentage of baseline. Times in heat map are referenced to infusion of biculline. RM ANOVA and a post-hoc Tukey test were performed to compare basal levels against post drug levels. *p < 0.05, **p < 0.01, ***p < 0.001 compared to basal level in the respective brain region. A line graph of these data is presented in Figure S3.

