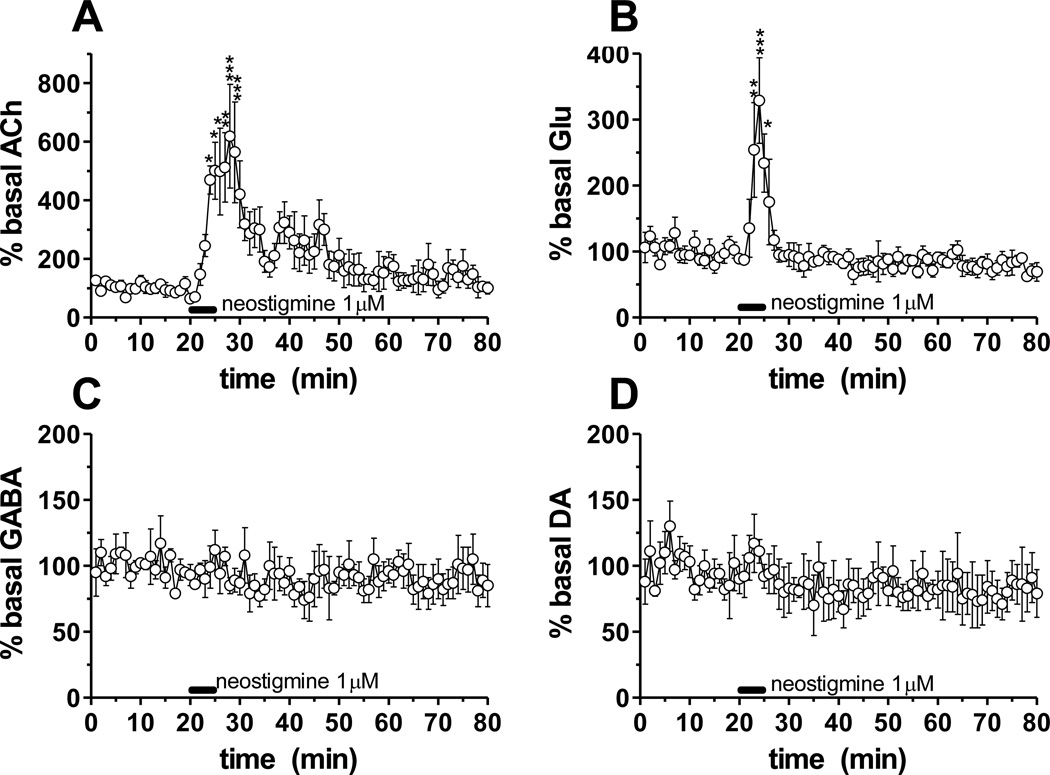
Figure 5.
Microdialysis in the mPFC. Neostigmine (1 µM) was perfused (black bar) for 5 min in the mPFC while neurotransmitters were monitored locally. Dialysate was collected every 60 s. Error bar is ± 1 SEM (n = 5). Data was expressed as percent of baseline levels. RM ANOVA and a post-hoc Tukey test to compare basal levels against post drug levels. *p < 0.05, **p < 0.01, ***p < 0.001 compared to basal mPFC level.

