Figure 5.
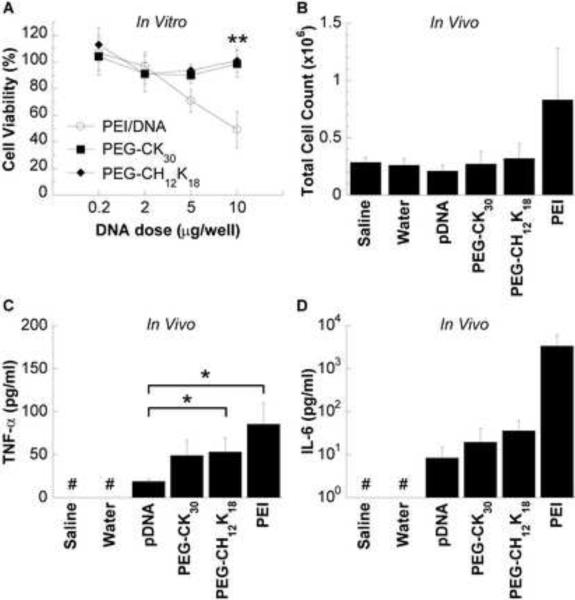
Safety profile of DNA nanoparticles formulated at pH 7.5. (A) In vitro metabolic activity of BEAS-2B cells as a function of DNA nanoparticle dose. * indicates statistically significant (** P < 0.01, Tukey HSD) as compared to PEI DNA nanoparticles. Bronchoalveolar lavage fluid (BALF) analysis of mice (n=5) treated with 100 μg of compacted or naked DNA by oropharyngeal aspiration and sacrificed 48 h after administration. (B) Total inflammatory cell counts. (C) Tumor necrosis factor alpha (TNF-α) concentration. # denotes values below the limit of detection. * denotes statistically significant (* P < 0.05, Games-Howell) as compared to pDNA. (D) Interleukin 6 (IL-6) concentration. # denotes values below the limit of detection. Data represents the mean +/− SD. Concentrations in BALF are adjusted for dilution by the urea method.

