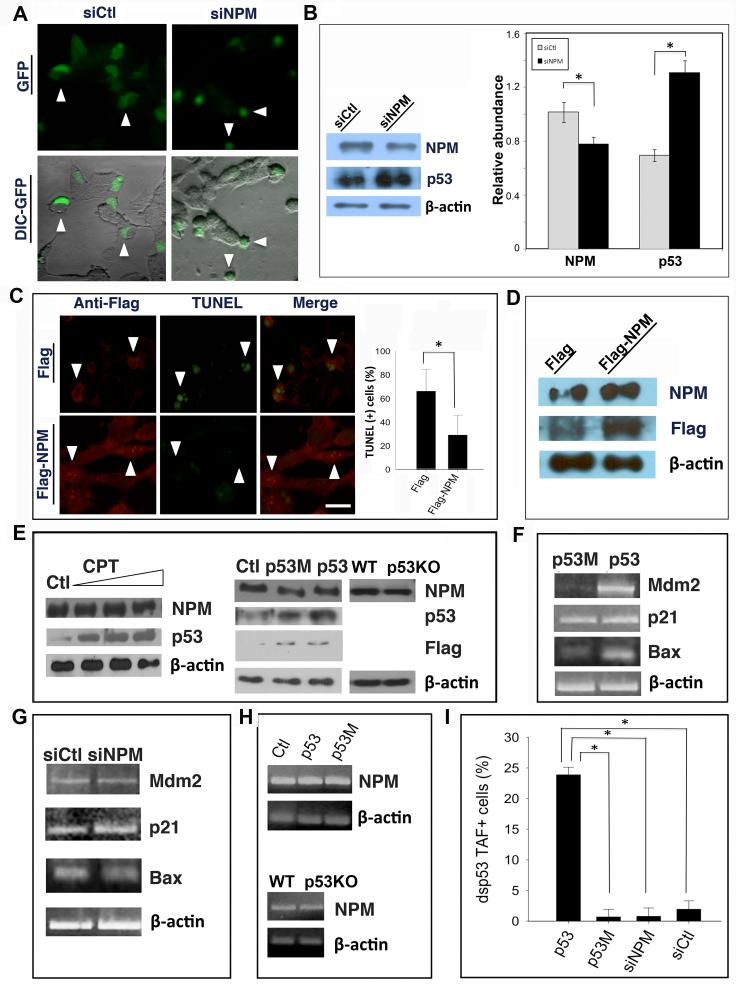
Figure 3. NPM overexpression promotes neuronal survival in a p53-independent manner.
(A) SH-SY5Y cells were co-transfected with pEGFP plus either NPM siRNA (siNPM) or a nonsense control siRNA (siCtl), and morphology visualized by fluorescence/DIC microscopy. GFP signal (green) indicates transfected cells, which exhibit normal morphology in the control group (arrowheads) and a shrunken appearance after NPM siRNA transfection (arrowheads). (B) Western blotting using NPM C-terminal antibody with quantification confirms a significant downregulation of NPM and induction of p53, relative to β-actin control, after transfection with NPM siRNA. (C) SH-SY5Y cells were transfected with plasmids expressing either Flag-NPM or Flag alone and then treated with KA. Dual fluorescence labeling using an anti-Flag antibody reveals that cells transfected with Flag-NPM are TUNEL(−) (arrowheads, lower panels), whereas most cells transfected with Flag alone are TUNEL+ (arrowheads, upper panels) by 24 hr after KA treatment. Quantification shows a significant reduction in the number of TUNEL(+) cells following transfection with Flag-NPM. (D) Western blot with either NPM or Flag antibodies confirms overexpression of NPM or Flag following Flag-NPM transfection in SH-SY5Y cells. β-actin was used as a loading control. (E) Left panels: SH-SY5Y cells were treated with increasing concentrations of camptothecin (CPT, 0.05~1.0 μM). Western blotting shows that there is no effect of CPT on NPM abundance in contrast to increased levels of endogenous p53. Right panels: SH-SY5Y cells were transfected with a plasmid expressing either Flag (Ctl), Flag-p53 (p53) or Flag-p53R173Q (p53M). Western blotting using a panel of antibodies as indicated shows no difference in NPM abundance in control cells compared with cells overexpressing either Flag-tagged wild type or mutant p53. NPM abundance is also unchanged in hippocampal lysates from p53 knockout mice (p53KO) compared with wild type (WT) controls. β-actin was used as a loading control. (F) RT-PCR analyses of p53-regulated genes Mdm2, p21 and Bax in SH-SY5Y cells after overexpression of either p53 or p53M or (G) following siRNA transfection. (H) Upper: RT-PCR analysis of NPM expression in SH-SY5Y cells transfected with either p53 or p53M plasmids. Lower: RT-PCR analysis of NPM expression in hippocampus of either p53KO or wild type mice. β-actin was used as an internal loading control. (I) SH-SY5Y cells were co-transfected with dsp53TAF, a reporter of p53 transcriptional activity, and either p53-GFP, p53R173Q-GFP (p53M), siNPM or siCtl plus pEGFP. Bar graphs show the number of p53TAF+ cells (%) following transfection with each of the indicated reagents. Bar graphs in (B), (C) and (I) are depicted as mean ± SEM; * denotes p < 0.05. Scale bar = 10 μm in (A) and (C).

