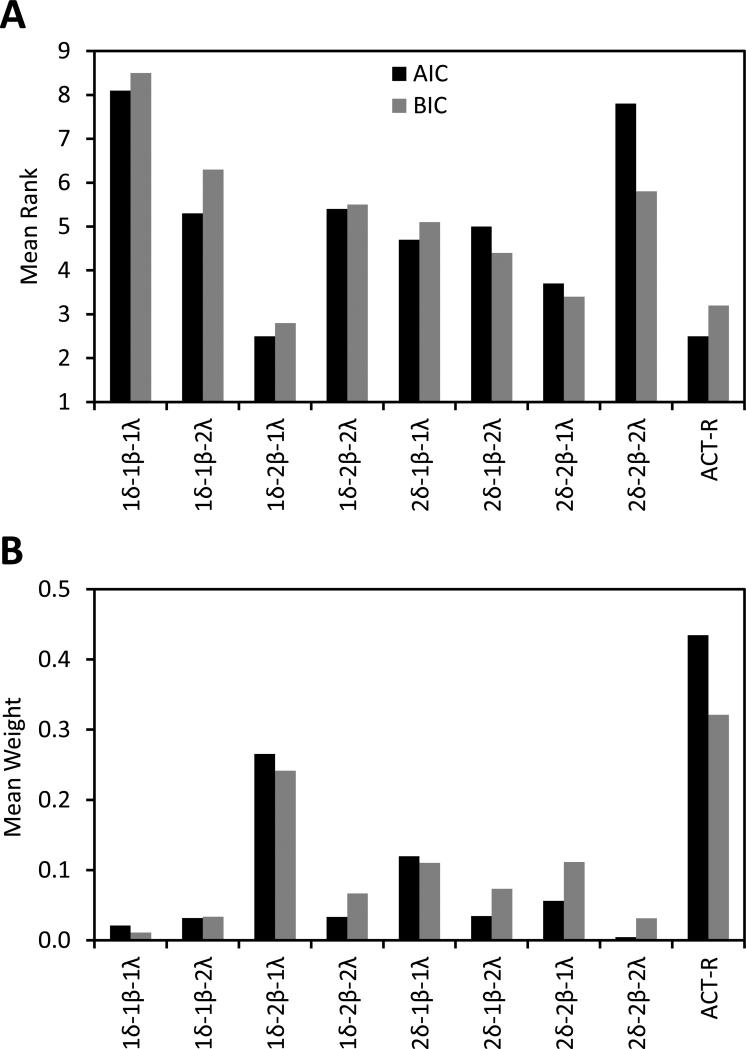
Figure 9.
Model comparison results for the fits to data from our experiment. The first eight pairs of bars refer to different variants of the shifted exponential function involving either one or two intercepts (δ), rates (β), and asymptotes (λ) for the Fan 1 and the Fan 2 conditions. The last pair of bars refers to the ACT-R model. A: Rank statistics (lower is better). B: Model weights (higher is better).

