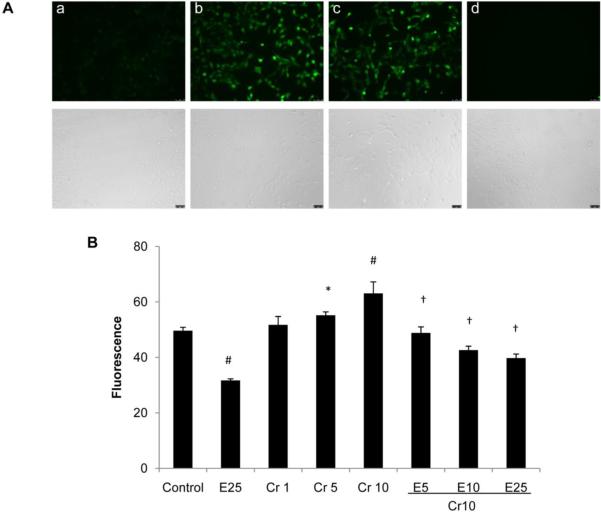
Fig. 3.
EGCG inhibits Cr(VI)-induced intracellular ROS generation. A, BEAS-2B cells were simultaneously treated with Cr(VI) and EGCG for 2 h and fluorescence micrographs were taken. (a) negative control, (b) positive control (100 μM H2O2), (c) 5 μM Cr(VI), and (d) 5 μM Cr(VI)+ 25 μM EGCG. Bright-field images are shown below the fluorescence micrographs. B, BEAS-2B cells were treated with increasing doses of Cr(VI) (1, 5, and 10 μM) and EGCG (5, 10, and 25 μM) for 24 h. The fluorescence was quantified using a plate reader. Values are shown as Mean ± SD (n = 3). *P < 0.05 vs control, #P < 0.01 vs control, †P < 0.01 vs Cr10.

