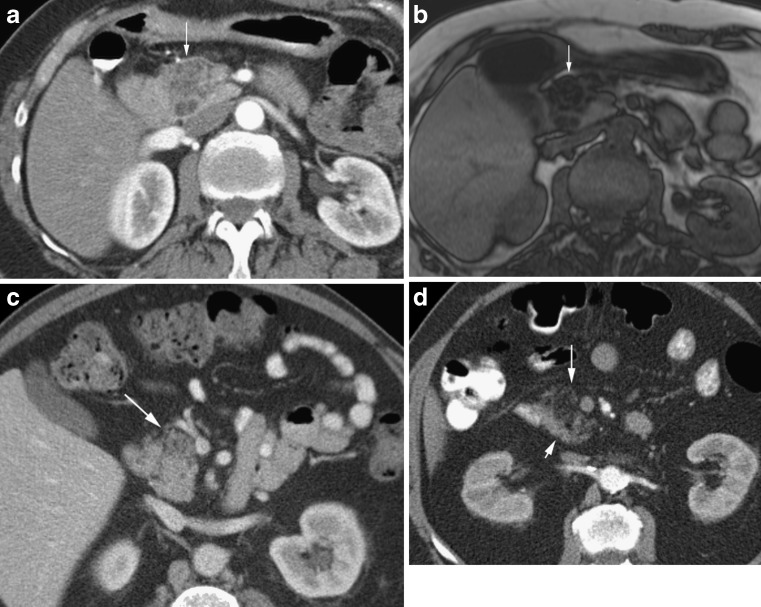
Fig. 5.
a Arterial phase CT in an 86-year-old diabetic patient with a hypodense mass-like region (arrow) in the head of the pancreas. Some elements within have Hounsfeld units of less than 50 in keeping with focal fatty infiltration. b T1 MRI out of phase MRI in the same patient at a comparable level showing signal dropout (arrow) confirming focal fatty infiltration. c Focal fatty infiltration in the anterior pancreatic head (arrow). Note the absence of mass effect. d More pronounced focal fatty infiltration of the anterior pancreatic head (long arrow) compared with the normal density posterior pancreas (short arrow)

