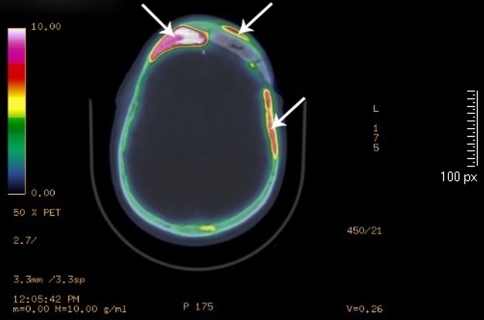
Fig. 6.
PET-CT picture of implant 2 years after reconstruction. (18)F-fluoride marker was used. The implant is in the correct position in the skull. Metabolic activity is shown with colors (white arrows). The highest activity is shown with red and yellow, while green shows lower activity. The middle arrow shows activity on the implant’s outer surface (yellow and red areas), while the other two arrows show activity at the border between the implant and bone (yellow and red areas, patient 1)

