. 2011 Feb 2;16(1):109–115. doi: 10.1007/s00784-011-0514-2

Fig. 2.

Fig. 2

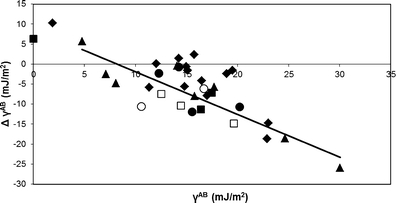
The change in acid–base surface free energy components \documentclass[12pt]{minimal} \usepackage{amsmath} \usepackage{wasysym} \usepackage{amsfonts} \usepackage{amssymb} \usepackage{amsbsy} \usepackage{mathrsfs} \usepackage{upgreek} \setlength{\oddsidemargin}{-69pt} \begin{document}$$ \Delta \gamma_{\rm{s}}^{\rm{AB}} $$\end{document} of SCFs with and without exposure to a toothpaste slurry or mouthrinse upon renewed exposure to saliva as a function of the SCF acid–base surface free energy component \documentclass[12pt]{minimal} \usepackage{amsmath} \usepackage{wasysym} \usepackage{amsfonts} \usepackage{amssymb} \usepackage{amsbsy} \usepackage{mathrsfs} \usepackage{upgreek} \setlength{\oddsidemargin}{-69pt} \begin{document}$$ \gamma_{\rm{s}}^{\rm{AB}} $$\end{document} immediately after exposure to a toothpaste slurry or mouthrinse. All data points represent measurements over three separately prepared samples, with an average SD of 3.4 mJ/m2. Linear correlation coefficient equals 0.79. Symbols denote: empty circle, untreated SCF (“pellicle”); shaded diamond, commercially available toothpastes; shaded triangle, experimental toothpastes; shaded circle, commercially available mouthrinses; empty square, experimental mouthrinses; shaded square, exposure to a toothpaste slurry followed by a mouthrinse treatment