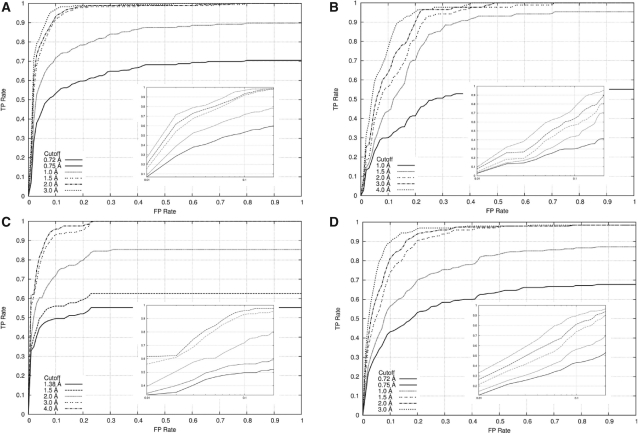
Fig. 3.
ROC curves to assess the classification performance of MetalionRNA with the width of 0.5Å for the cubic grid C using (A) the RNA-Mg2+ dataset, (B) the RNA-Na+ dataset, (C) the RNA−K+ dataset, (D) the DNA-Mg2+ dataset and various cut-off distance values (the maximum distance between a predicted and a real metal ion in which the prediction is marked as correct). In the big picture overall graph is shown, in the small picture only a range between 0 and 0.2Å is illustrated on a logarithmic scale.

