Figure 1.
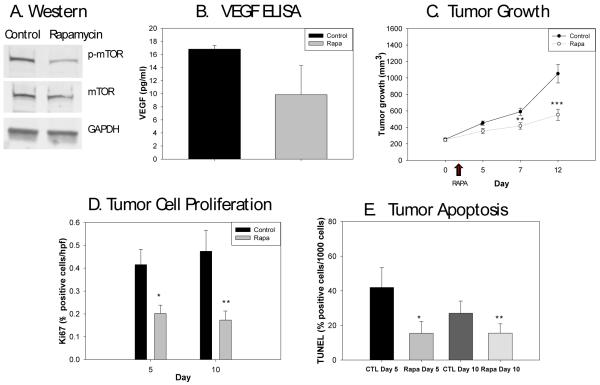
Effects of rapamycin treatment on Rh30 cells. 1A) Western blot analysis shows decreased phosphorylation of mTOR in the tumor cells treated with rapamycin compared to control cells. GAPDH was used as a control for comparison. 1B) VEGF levels were lower in rapamycin treated mice compared to controls (p=0.05). 1C) Rapamycin was administered on days 2-7 of tumor growth measurements (arrow indicating administration of rapamycin). Rapamycin treated tumors were significantly smaller compared to control tumors at day 5 (*p=0.02), day 7 (p=**0.008), and day 12 (***p=0.001). 1D) The percentage of cells actively proliferating was significantly less in the rapamycin treated tumors on days 5 (*p=0.0000003) and 10 (**p=0.0000008) after the start of therapy compared to controls. 1E) Apoptosis, as determined by TUNEL, was significantly decreased after 5 days of rapamycin compared to controls (*p=0.00002), and this difference persisted 5 days later (**p=0.003).

