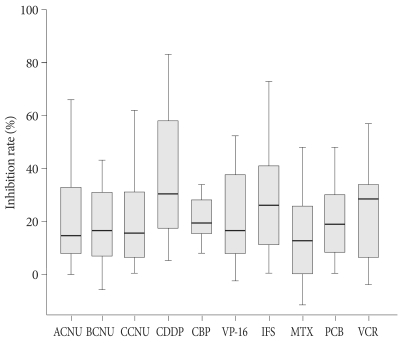
Fig. 1.
The inhibition rates of each drug obtained by HDRA are plotted in histogram. Solid horizontal bars represent median value. Rectangular box is 95% confidence interval and I shape bar indicates range of the observed value, respectively. HDRA : Histoculture Drug Response Assay, ACNU : nimustine, BCNU : carmustine, CCNU : lomustine, CDDP : cisplatin, CBP : carboplatin, VP-16 : etoposide, IFS : ifosfamide, MTX : methotrexate, PCB : procarbazine, VCR : vincristine.

