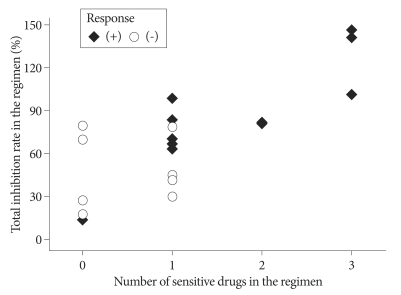
Fig. 2.
Scatter plot representing the number of HDRA sensitive drugs (X axis) and total inhibition rate (the sum of inhibition rate of each drug, Y axis) in the chosen chemotherapy regimen. Filled lozenge is individual who showed tumor response and hallow circle is non-responder. HDRA : Histoculture Drug Response Assay.

