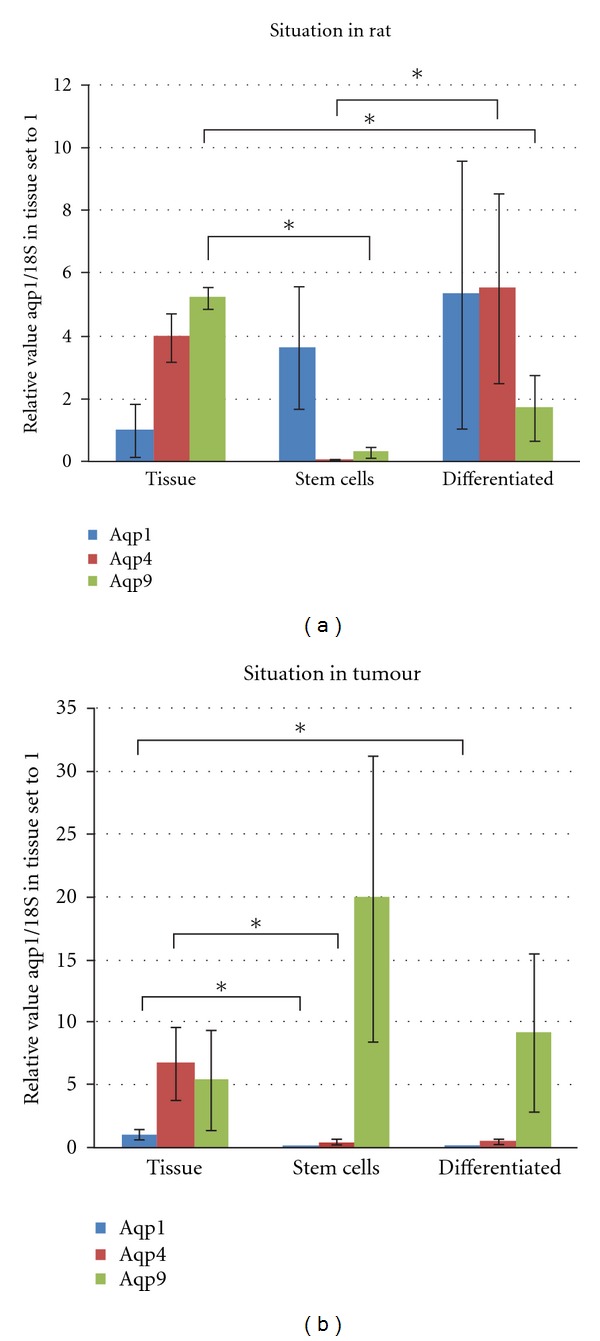
Figure 1.

q-PCR analysis of mRNA expression of aquaporins 1, 4, and 9 in rat versus glioblastoma. (a) Levels of aquaporins in rat tissues. Progenitors mainly express aqp1. Differentiated cells expressed all three with aqp9 expressed the least. *values that differ statistically using unpaired two-sampled Student's t-test and considered significant when P < 0.05. (b) Levels of aquaporins in tumour tissues. In the progenitor and differentiated cell populations, aqp9 was conspicuously dominant compared to aqp1 and 4. *values that differ statistically using unpaired two-sampled Student's t-test and considered significant when P < 0.05.
