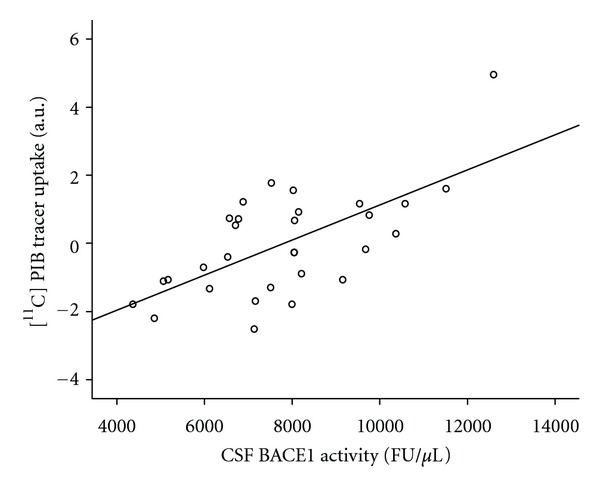
Figure 2.

Linear regression analysis of fitted and adjusted [11C]PIB uptake and CSF BACE1 activity at the localization of the most significant cluster (Talairach's coordinates x/y/z 18/−24/−9, right parahippocampal gyrus, Brodmann's area 35), FU: fluorescence units.
