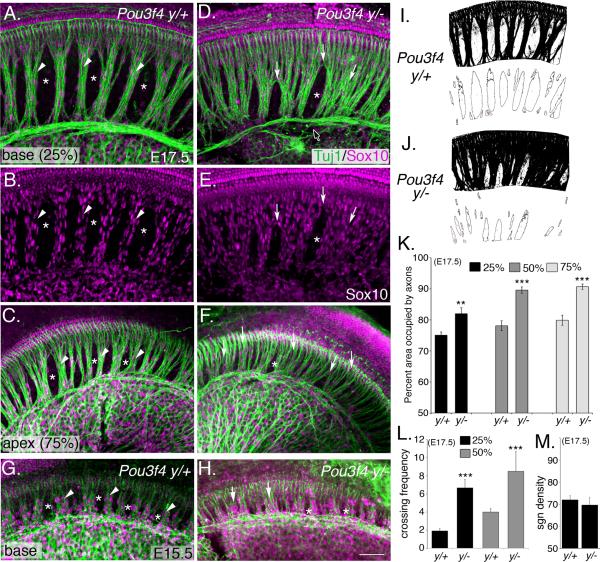
Figure 2. Absence of Pou3f4 causes defects in fasciculation of inner radial bundles.
(A–C) Representative images of the base (A) and apex (C) from a Pou3f4y/+cochlea at E17.5. Arrowheads point to appropriately formed inner radial bundles; asterisks label bands of otic mesenchyme cells.
(D–F) Whole mount images as in A–C but from Pou3f4y/−. Arrows point to defasciculated axons. The black arrow (with white stroke) points to the intraganglionic spiral axon bundle (Simmons et al., 2011) that also shows fasciculation defects. As in F, glial cells display a similar ectopic pattern.
(G) At E15.5, the inner radial bundles are apparent (arrowheads), as well as regions of mesenchyme (asterisks).
(H) Pou3f4y/− cochlea at E15.5. Fasciculation defects are already evident. Scale bar: 50 μm.
(I–J) Illustration of the scheme by which the radial bundle phenotype was quantified.
(K and L) Histograms illustrating significant increases in axon fasciculation defects (K) and the number of times per 500 μm that individual processes cross between fascicles (L) in Pou3f4y/− cochleae. Percentages indicate the position along the length of the cochlea with respect to the distance from the base. **P ≤ 0.01; ***P ≤ 0.001.
(M) The density of neurons along the length of the cochlea is unchanged between Pou3f4y/+ and Pou3f4y/− mice. K–M: mean +/− SEM. Scale bar: 50 −m.

