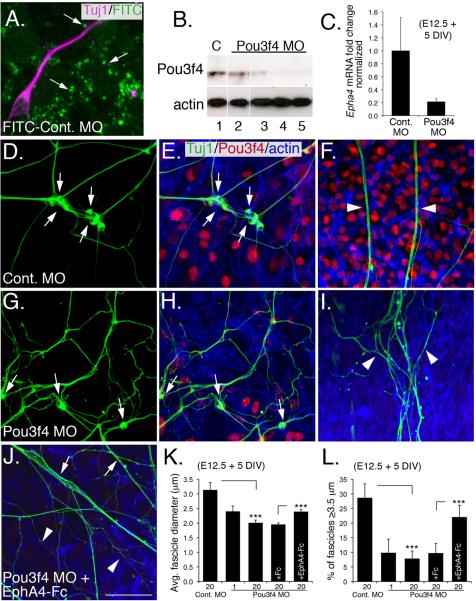
Figure 6. Exogenous EphA4 protein rescues Pou3f4-dependent fasciculation defects in vitro.
(A) Co-culture of SGNs (magenta) and mesenchyme cells. Punctate FITC-labeling indicates uptake of FITC-conjugated control MO by endocytic vesicles.
(B) Western blot demonstrating knockdown of endogenous Pou3f4 by a Pou3f4 MO. Lane 1: 20 μM control MO; lane 2: 1 μM Pou3F4 MO; lanes 3–5: three different samples treated with 20 μM Pou3f4 MO. Anti-β-actin, loading control.
(C) Quantitative PCR demonstrates a 5-fold reduction of Epha4 transcripts in mesenchyme cells treated with the Pou3f4 MO. DIV: days in vitro.
(D–J) SGN/otic mesenchyme co-cultures treated with indicated MO. Green: anti-Tuj1 (neurons); red: anti-Pou3f4; blue: phalloidin (actin).
(D–F) In the presence of 20 μM control MO, SGN cell bodies cluster (arrows in D,E) and have axons that form thick, straight fascicles that extend away from the cell bodies (arrowheads in F).
(G–I) Treatment with 20 μM Pou3f4 MO decreases clustering of cell bodies (arrows in G,H), as well as decreased axon fasciculation (arrowheads in I). In addition, individual fibers follow more convoluted paths. Knock down of Pou3f4 is illustrated in (H).
(J) Treatment with 20 μM Pou3f4 MO + 10 nM EphA4-Fc increases incidences of thick, straight fascicles (arrows) although single non-fasciculated neurites are still present (arrowheads). Scale bar: 20 μm for A; 40 μm for D–J.
(K,L) Histograms illustrating changes in average fascicle diameter (μm) and average percentage of “large” ≥ 3.5 μm fascicles among the different treatment groups. ***P ≤ 0.001. C,K, and L, mean +/- SEM.

