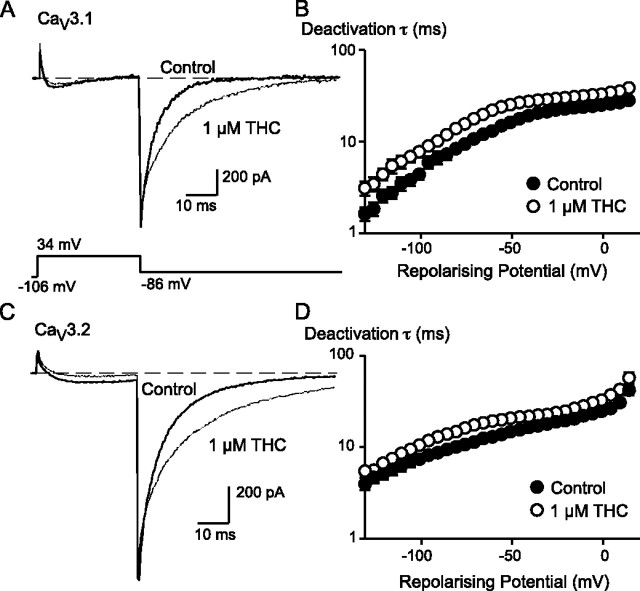
FIGURE 11.
THC slows deactivation of CaV3 channels at all test potentials. The effect of 1 μm THC on CaV3.1 deactivation is illustrated in A. The cell was voltage-clamped at -106 mV and stepped to +34 mV. The trace in the presence of THC was normalized to amplitude of the tail current of the control trace to allow ready comparison of the inactivation kinetics. B, the constant of deactivation of CaV3.1 channels at various potentials from a holding potential of -106 mV. The effect of 1 μm THC on CaV3.2 deactivation is illustrated in C. The cell was voltage-clamped at -106 mV and stepped to +34 mV. The trace in the presence of THC was normalized to the amplitude of the tail current of the control trace to allow ready comparison of the inactivation kinetics. D, the constant of deactivation of CaV3.2 channels at various potentials from a holding potential of -106 mV. Each point represents the mean ± S.E. of 6 cells. In the presence of THC, the time constants for deactivation were significantly different from the control for both channels (ANOVA, p < 0.05).

