
FIGURE 3.
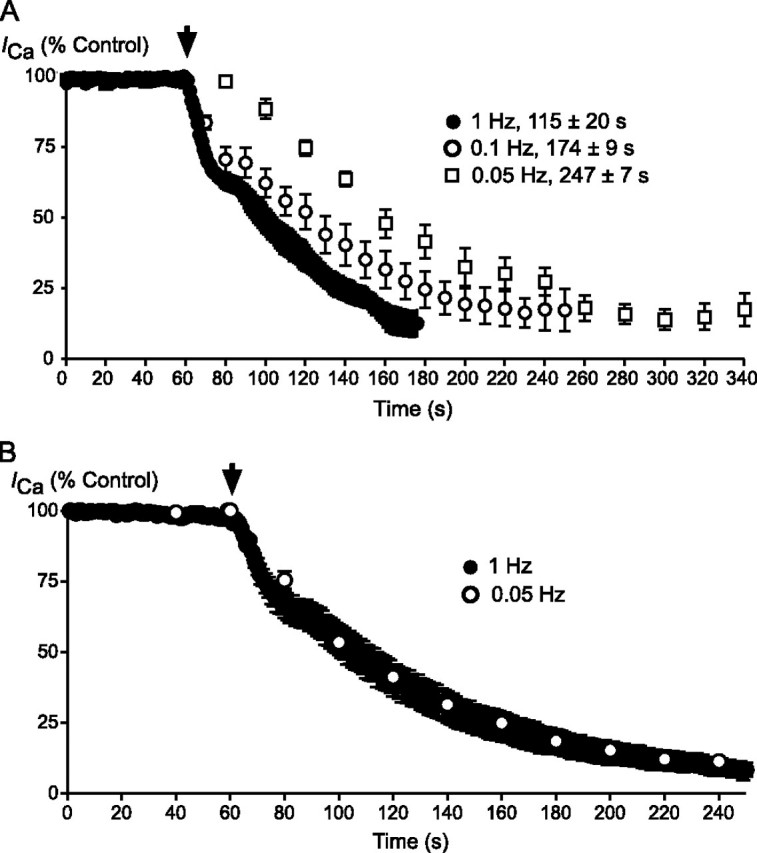
The onset of THC inhibition of CaV3.1 is use-dependent, and that of CBD is not. A, cells expressing CaV3.1 currents were stepped repetitively at 1, 0.1, and 0.05 Hz. 3 μm THC was superfused from the point indicated by the arrowhead. Each point represents the mean ± S.E. of 6 cells. The time to reach maximal inhibition is indicated on the figure; the times were significantly different at each frequency (one-way ANOVA, p < 0.05). B, cells expressing CaV3.1 currents were stepped repetitively at 1 and 0.05 Hz. 3 μm CBD was superfused from the point indicated by the arrowhead. Each point represents the mean ± S.E. of 6 cells; there was no difference in the time taken for CBD inhibition to reach equilibrium.