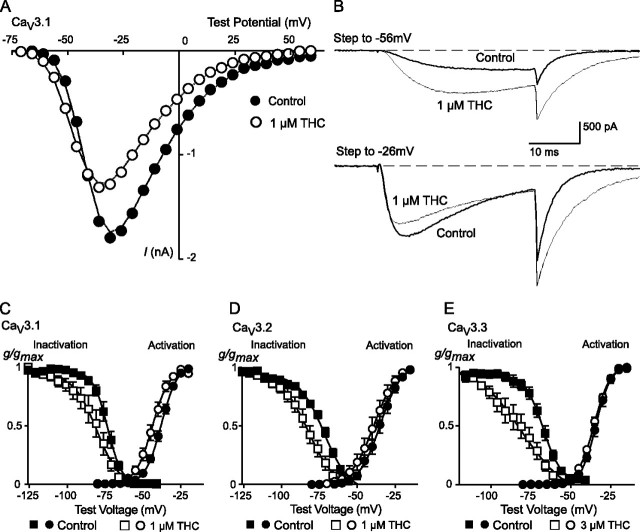
FIGURE 6.
THC affects the activation and inactivation of CaV3 channels. A, current-voltage (I-V) relationship showing the activation of CaV3.1 from a holding potential of -106 mV in the absence and presence of 1 μm THC. The peak inward current amplitude is plotted. B, example traces from this experiment illustrating the effect of 1 μm THC at test potentials of -56 and -26 mV; current is enhanced at lower test potentials and inhibited at more depolarized potentials. The effects of THC on activation and steady state inactivation of CaV3 currents are illustrated: C, CaV3.1; D, CaV3.2; E, CaV3.3. Cells were voltage-clamped at -106 mV. For steady state inactivation, cells were voltage-clamped at the test potential for 2 s before currents were evoked by a step to -26 mV. For steady state inactivation, data are presented as conductance normalized to conductance at -26 mV; for activation curves data are normalized to the maximum conductance. The data are fitted with a Boltzmann equation; the effects of THC on activation and inactivation parameters are reported in Table 2. Each data point represents the mean ± S.E. of 6 cells.

