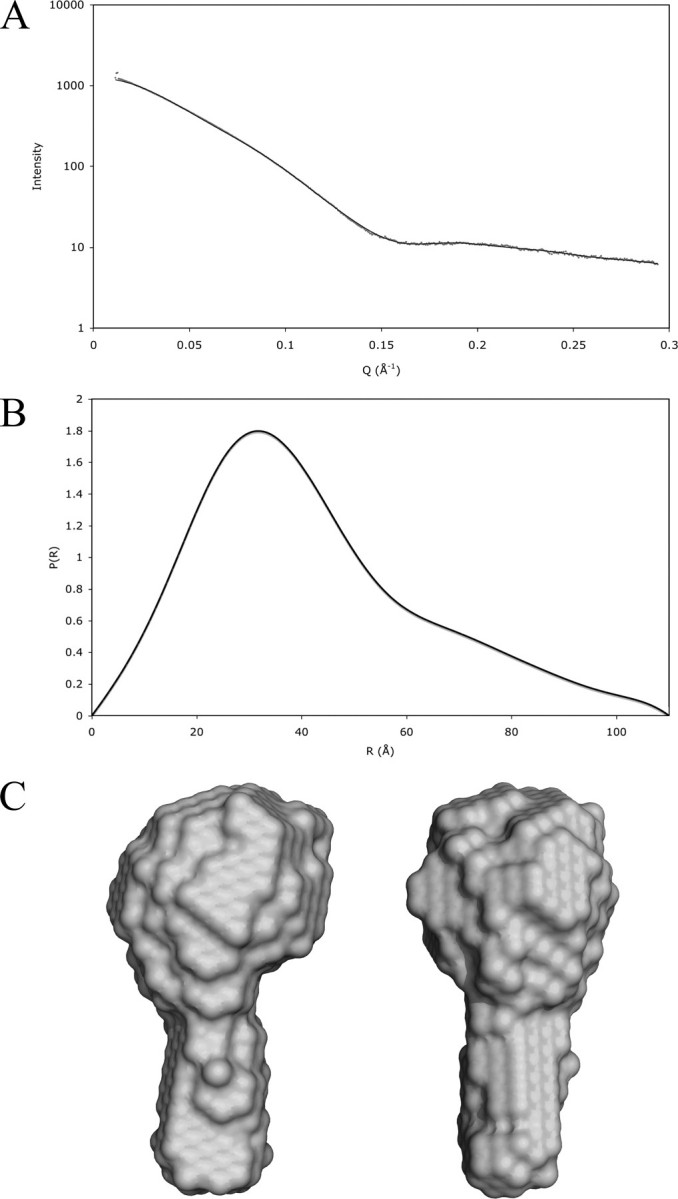
FIGURE 2.

Small-angle x-ray scattering data and calculated low resolution structure of free cortactin. A shows a plot of the raw scattering data; Data points are shown in gray with the fit from the DAMMIN model overlaid as a black line. B shows the P(R) function from GNOM. C shows two views of the envelope structure of cortactin calculated from the scattering data by the program DAMMIN. Ten independent calculations were made with good convergence, and the χ-square of the fit of the most representative model is 0.0692. These were averaged together and plotted at 95% confidence interval by the program Damfilt.
