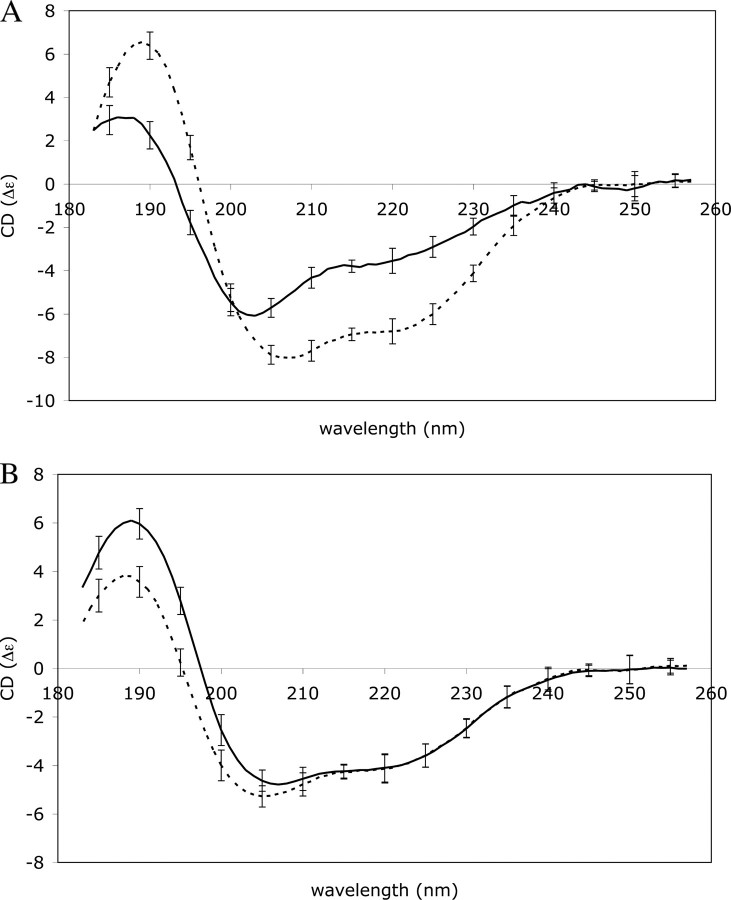
FIGURE 3.
CD spectra of cortactin, actin, and the complex measured between 260 and 180 nm on a Jasco J-810 instrument and smoothed using a 3-nm box car average. A shows the individual spectra of cortactin (solid line) and f-actin (broken line). B shows the measured spectrum of a complex between f-actin and cortactin (solid line) and the theoretical spectrum of the complex calculated by combining the spectra of free f-actin and cortactin from panel A (broken line).

