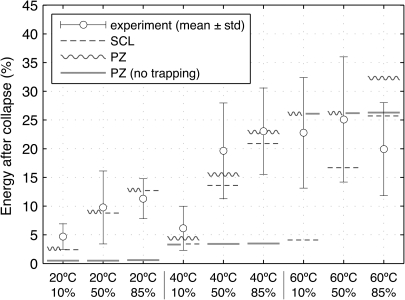
Figure 4.
(Color online) Comparison of various model predictions with experimental observations with regard to the energy retained after the collapses of lithotripsy bubbles. Two tuning parameters (fm=0.998 and Am=0.8) are used to fit eight separate groups of observations. Included here for completeness, the ninth experimental group at 60 °C and 85% dissolved oxygen was deemed unreliable given the presence of supersaturated carbon dioxide bubbles under the test conditions. Open circles and associated vertical bars represent the mean ± 1 standard deviation of experimental observations at each water condition.19 Considering x axis conditions from left to right in the plot, experimental data represent 12, 13, 6, 5, 20, 23, 46, 43, and 22 independent bubble collapses, respectively.

