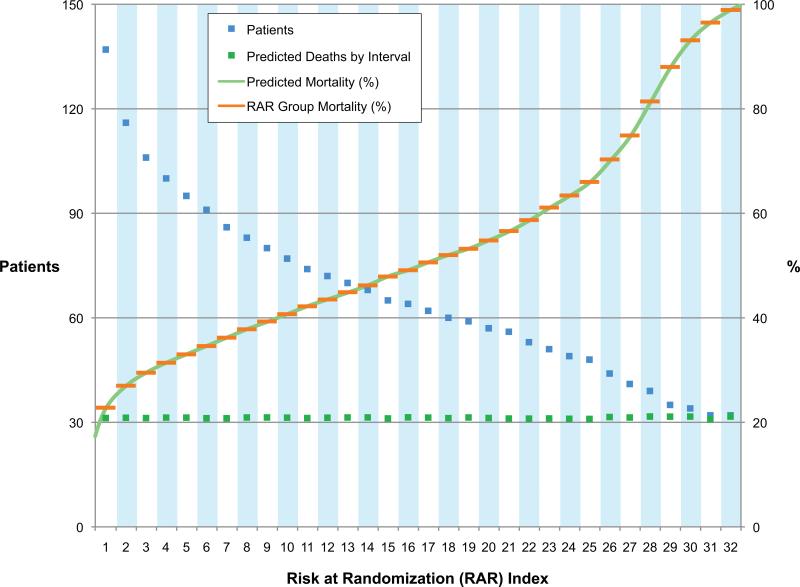
Figure 1. Risk at Randomization Development.
The continuous green line represents the 2136 data points of individual patient mortality predicted from the multivariable model. The interrupted green lines represent total predicted deaths for all patients in each RAR group. The interrupted blue lines depict the total number of patients in each RAR group. The interrupted orange line represents the RAR group mortality assigned to each patient in each RAR group.

