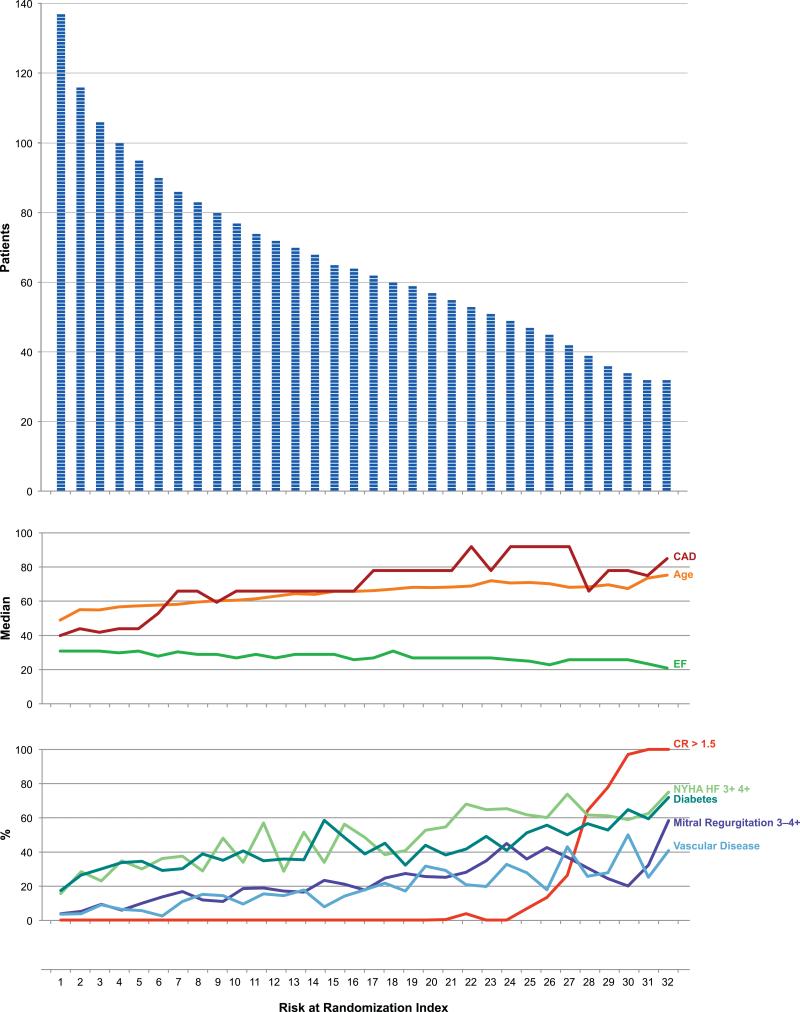
Figure 3. Patients and Corresponding Clinical Characteristics by RAR.
This histogram depicts the individual patients at each RAR interval. The corresponding median age, ejection fraction, and Duke CAD index for each RAR group and the percent of patients in each RAR group with baseline creatinine ≥1.5, ≥ NYHF class III, diabetes, mitral regurgitation ≥3+, and vascular disease provided a comprehensive summary of the components of risk for the entire population.

