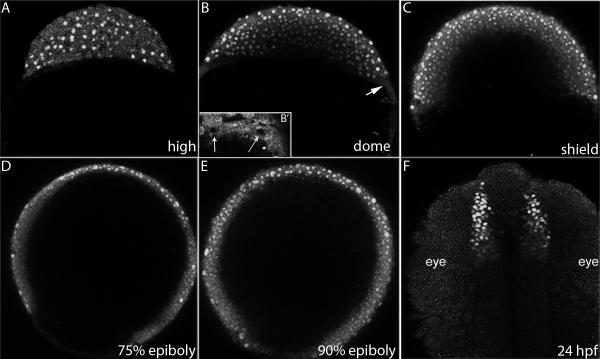
Figure 2. Eomesa protein distribution.
Confocal projections of embryos stained with anti-Eomesa antibody. (A-E) lateral views (F) dorsal view. Stages indicated in lower right. Arrow in (B) indicates the YSL. (B’) Inset shows YSL of embryo at sphere stage. Arrows indicate unstained YSL-nuclei that are surrounding by Eomesa positive YSL cytoplasm.

