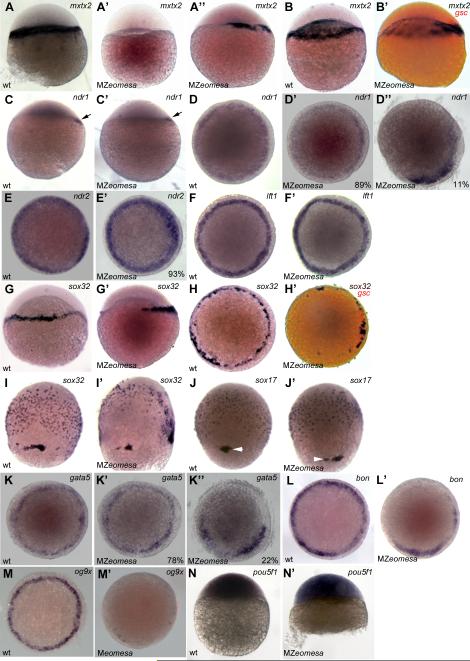
Figure 8. Expression of endoderm markers is reduced in MZeomesa embryos.
(A-C’, G, G’, I-J’) lateral views, (D-F’, H, H’, K-M’) animal pole views of embryos stained by whole mount in situ hybridzation. (A-B’) mxtx2 expression at sphere (A-A’’) and dome stage. (B’) gsc in red marks dorsal. (C-D’’) ndr1 expression at sphere (arrow, C,C’) and 40% epiboly (D-D’’). (E, E’) ndr2 expression at 40% epiboly. (F,F’) lft1 expression at 40% epiboly (G-H’) sox32 expression at 40% epiboly, (H’) gsc in red marks dorsal. sox32 expression (I,I’) and sox17 expression (J,J’) at 75% epiboly. Arrowheads indicate dorsal forerunner cells. (K-K’’) gata5 expression at 40% epiboly. (L,L’) bon expression at 40% epiboly (M,M’) og9x expression at 40% epiboly. (N.N’) pou5f1 at oblong/sphere. Genotypes indicated in lower left, probe in upper right and percentages of embryos that exhibited given phenotype shown in lower right where appropriate.

