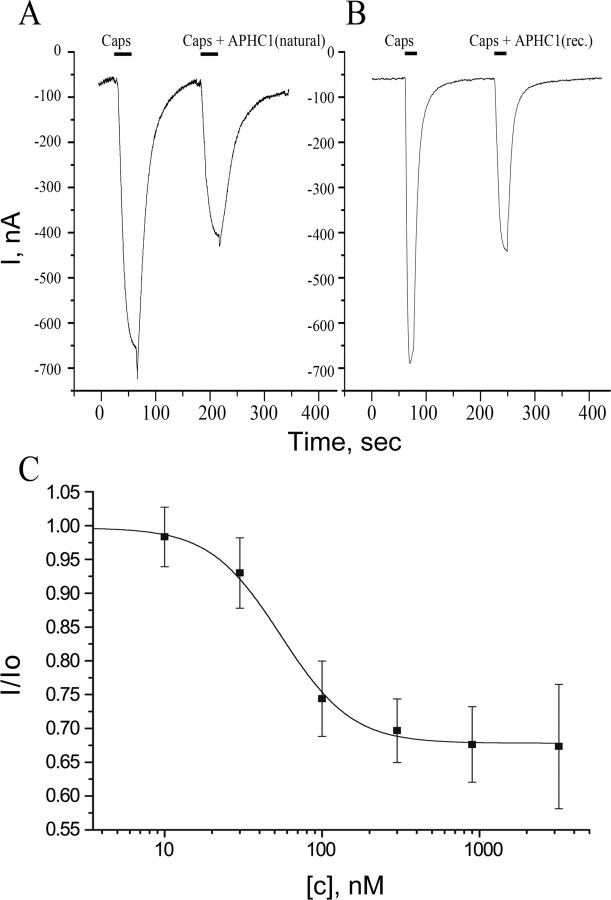
FIGURE 4.
Action of APHC1 on TRPV1 channels. A and B, application traces of capsaicin (Caps) alone and capsaicin mixed with purified natural APHC1 (final concentration 500 nm) (A) or with recombinant (rec.) APHC1 (final concentration 300 nm) (B). Channels were activated by 2 μm capsaicin 35 s (A) or 20 s (B) before washing, and oocytes were held at -50 mV. C, dose-response curve for APHC1 inhibitor activity on capsaicin-activated TRPV1 channels. The abscissa axis represents the ratio of ion current evoked by co-application of agonist and APHC1 (I) to ion current evoked by agonist alone (Io) on the same oocyte. Each point represents the mean ± S.E. with n = 4–8.

