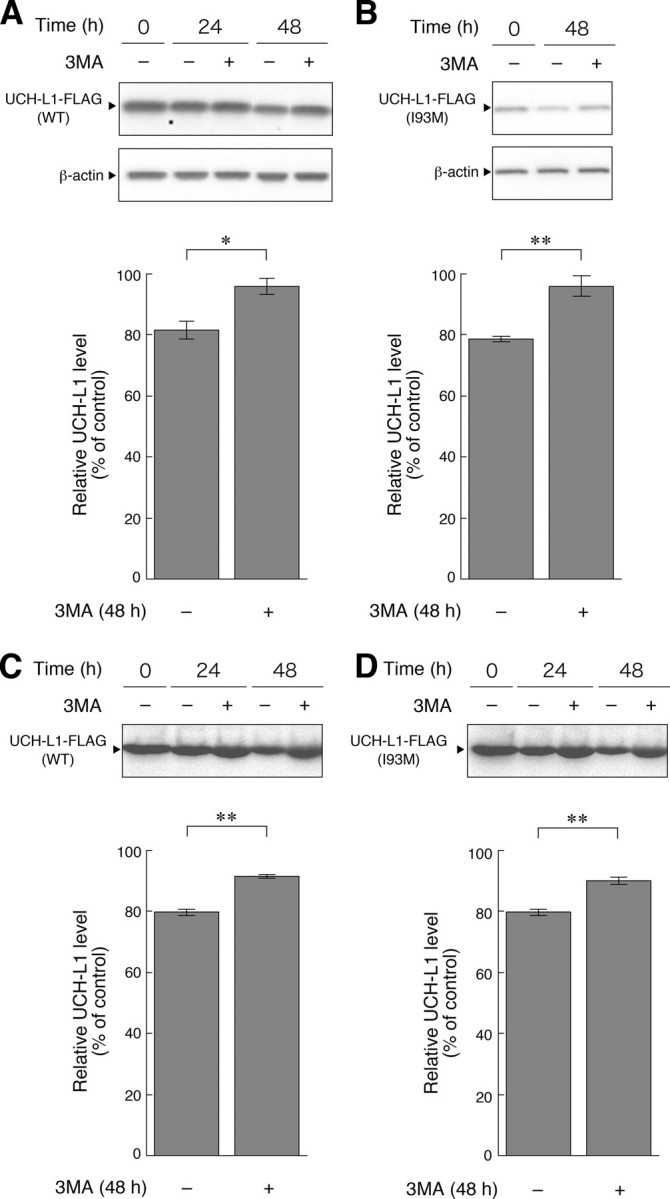
FIGURE 2.

Degradation of UCH-L1 by macroautophagy. A and B, COS-7 cells were transfected with pTet-Off and pTRE-Tight-hUCH-L1WT (A) or pTRE-Tight-hUCH-L1I93M (B). Twenty-four h after transfection, transcription of UCH-L1-FLAG gene was suppressed by adding 100 ng/ml doxycycline and incubating for 4 h. Then, 3-MA (+) or vehicle (–) was added, and cells were harvested at the indicated times after the suppression of the gene and analyzed by immunoblotting (upper panels). The relative levels of UCH-L1-FLAG at 48 h after the suppression (% of 0-h control) were quantified by densitometry. Mean values are shown with S.E. (A, n = 4; B, n = 3). *, p < 0.05; **, p < 0.01. C and D, COS-7 cells were transfected with pCI-neo-hUCH-L1WT-FLAG (C) or pCI-neo-hUCH-L1I93M-FLAG (D). Twenty-four h after transfection, cells were labeled with [35S]Met and [35S]Cys. Autoradiograms of anti-FLAG immunoprecipitates pulse-chased at the indicated times in the absence or presence of 3-MA are shown (upper panels). Relative band intensities at 48 h (% of 0-h control) are quantified. Mean values are shown with S.E. (n = 3). **, p < 0.01.
