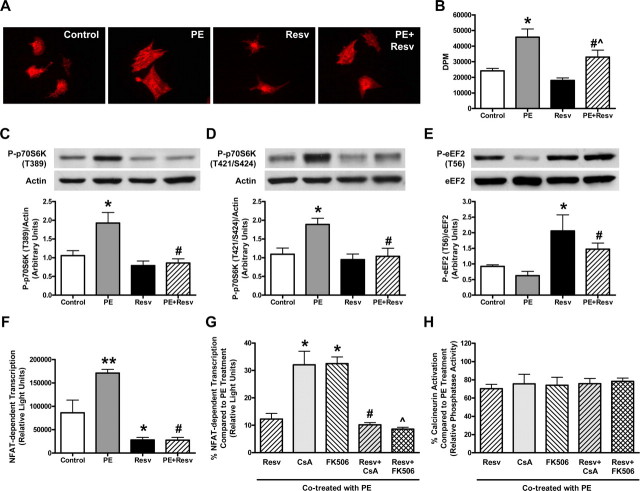
FIGURE 1.
Resveratrol blunts phenylephrine-induced cardiac myocyte hypertrophy and protein synthesis via the p70S6K, eEF2, and calcineurin-NFAT signaling pathways. A, qualitative representation of the cell size of neonatal rat cardiac myocytes treated with ethanol (Control) or 50 μm resveratrol (Resv), in the absence or presence of 10 μm phenylephrine (PE) for 24 h. Changes in cell size were visualized following fixation on coverslips using mouse anti-α-actinin and Texas Red-conjugated donkey anti-mouse antibodies. B, measurement of protein synthesis using [3H]phenylalanine incorporation with counts expressed in DPM (disintegrations per minute). Values are means ± S.E. with each experiment performed in duplicate (n = 4). *, p < 0.01 versus Control; #, p < 0.05 versus PE; ^, p < 0.05 versus Resv; assessed by ANOVA and Bonferroni multiple comparisons test. C-E, representative immunoblot and densitometry of cellular extracts from cardiac myocytes treated as described above. Values are expressed as means ± S.E. and analyzed with the Kruskal-Wallis test followed by Dunn's multiple comparisons test. C, cell lysates blotted with anti-phospho-p70S6K (T389) and anti-actin antibodies; *, p < 0.05 versus Control; #, p < 0.01 versus PE (n = 9-10). D, cell lysates blotted with anti-phospho-p70S6K (T421/S424) and anti-actin antibodies; *, p < 0.05 versus Control; #, p < 0.05 versus PE (n = 5-6). E, cell lysates blotted with anti-phospho-eEF2 (T56) and anti-eEF2 antibodies; *, p < 0.05 versus Control; #, p < 0.01 versus PE (n = 8-9). F, cellular extracts of cardiac myocytes infected with Ad.NFAT-Luc-Promoter adenovirus and treated as described above were assessed for NFAT-dependent transcription, measured as luciferase activity expressed in relative light units. Values are means ± S.E. with each sample assessed in duplicate (n = 5); **, p < 0.001 versus Control; *, p < 0.05 versus Control; #, p < 0.001 versus PE, analyzed by ANOVA and Bonferroni multiple comparisons test. G and H, myocytes infected with Ad.NFAT-Luc-Promoter adenovirus were treated with 500 ng/ml (416 nm) of CsA or 150 ng/ml (182 nm) of 506 with or without 50 μm Resv, in the presence of 10 μm PE for 24 h. G, NFAT-dependent transcription measured from cellular extracts is presented as a percentage (%) compared with PE treatment, where values are means ± S.E. with each sample assessed in duplicate (n = 4); *, p < 0.001 versus Resv; #, p < 0.001 versus CsA; ^, p < 0.001 versus FK506, analyzed by ANOVA and Bonferroni multiple comparisons test. H, calcineurin activity measured from cellular extracts is presented as a percentage (%) compared with PE treatment, where values are means ± S.E. with each sample assessed in duplicate (n = 4-5), analyzed by ANOVA.

