
FIGURE 3.
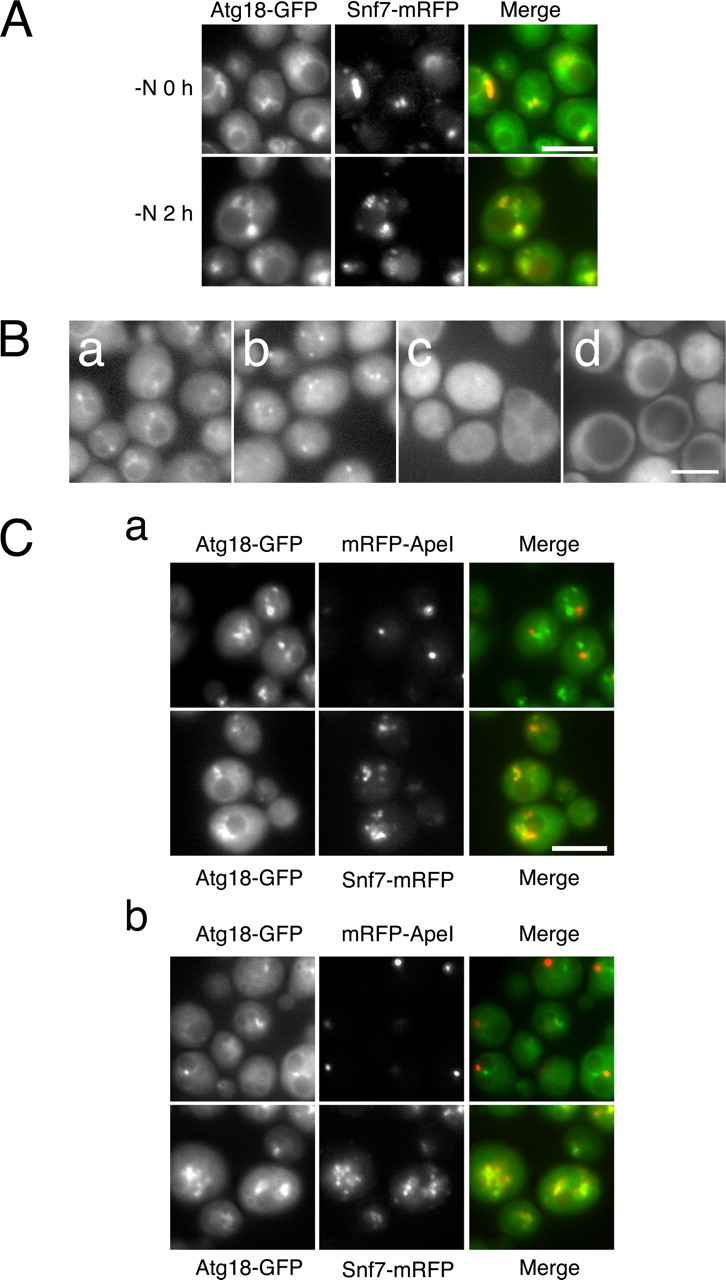
Localization of Atg18. A, cells expressing Atg18-GFP and Snf7-mRFP at logarithmic phase (-N0h) and under starvation condition (-N2 h) were subjected to fluorescence microscopy. Atg18-GFP and Snf7-mRFP were excited and detected simultaneously (see “Experimental Procedures”). B, localization of Atg18-GFP was observed by fluorescence microscopy at logarithmic phase (a) and after 4 h of nitrogen starvation (b). Localization of Atg18(FTTG)-HA-GFP was observed after 4 h of nitrogen starvation (c). In d, Atg18-GFP was observed in vps34Δ cells expressing the Vps34N736K variant. C, Atg18-GFP was observed in atg2Δ cells expressing mRFP-ApeI or Snf7-mRFP, PAS and endosome marker, respectively, at logarithmic growth phase (a) and 2 h of nitrogen starvation (b). The GFP and mRFP signals were detected at the same time points as in A. Bars, 5 μm.