FIGURE 5.
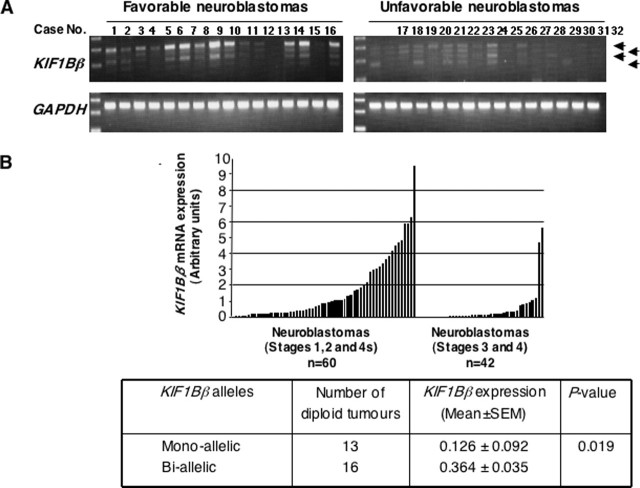
Expression levels of KIF1Bβ in primary neuroblastomas. A, semi-quantitative RT-PCR analysis. Total RNA was prepared from favorable (n = 16; stages 1 and 2, MYCN single copy) and unfavorable (n = 16; stages 3 and 4, MYCN amplified) neuroblastomas and subjected to semi-quantitative RT-PCR to examine the expression levels of KIF1Bβ. Glyceraldehyde-3-phosphate dehydrogenase (GAPDH) was used as an internal control. B, quantitative real time PCR. Expression levels of KIF1Bβ were standardized using the corresponding glyceraldehyde-3-phosphate dehydrogenase value of each neuroblastoma sample. The relative expression levels of KIF1Bβ in favorable (stages 1, 2, and 4s) and advanced (stages 3 and 4) neuroblastomas are shown (upper panel). Lower panel shows a significant correlation between mono-allelic loss of KIF1Bβ gene and its lower expression levels.

