
FIGURE 4.
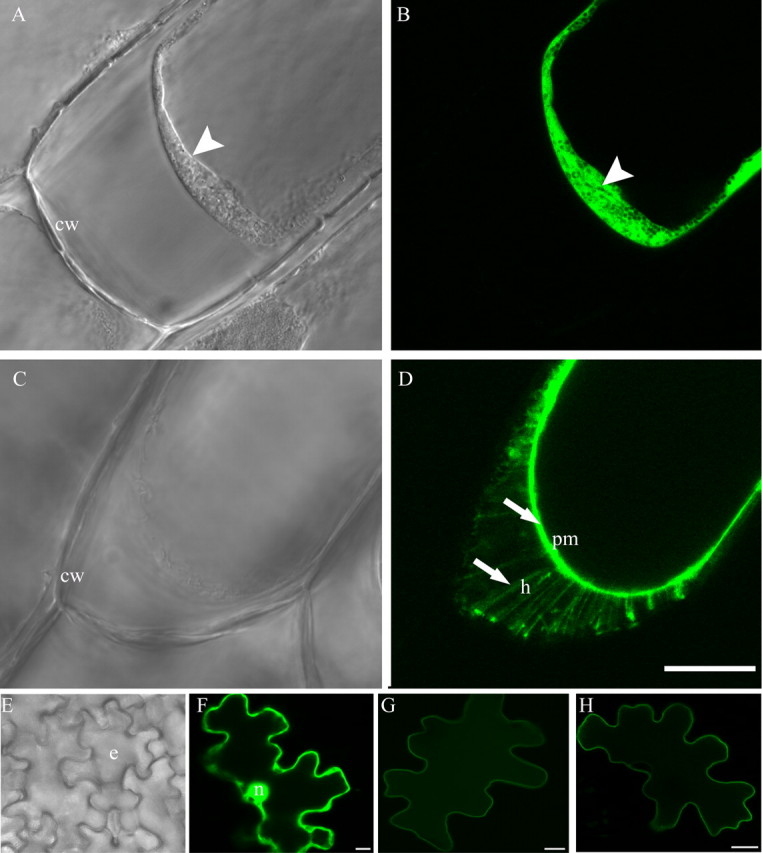
Subcellular locations of MtPT3 and MtPT5. Onion epidermal cells and M. sativa leaf epidermal cells expressing GFP and phosphate transporter:GFP fusion proteins. A and B, brightfield and corresponding fluorescence image of a partially plasmolyzed onion epidermal cell expressing free GFP. Arrowhead indicates the cytoplasm and free GFP in the cytoplasm; C and D, brightfield and corresponding fluorescence image of a partially plasmolyzed onion epidermal cell expressing MtPT3:GFP. Arrow indicates GFP fluorescence in the plasma membrane (pm) and Hechtian strands (h). E, brightfield image of M. sativa leaf epidermis showing epidermal cells (e). F–H, fluorescence images of single M. sativa epidermal cells expressing free GFP and fusion proteins. F, M. sativa epidermal cell expressing free GFP; G, M. sativa epidermal cell expressing MtPT3:GFP; H, M. sativa epidermal cell expressing MtPT5:GFP. Nucleus (n), cell wall (cw), and plasma membrane (pm) are indicated. Bar: D = 50 μm and is representative of A–D. Bars in F–H = 10 μm.