
FIGURE 5.
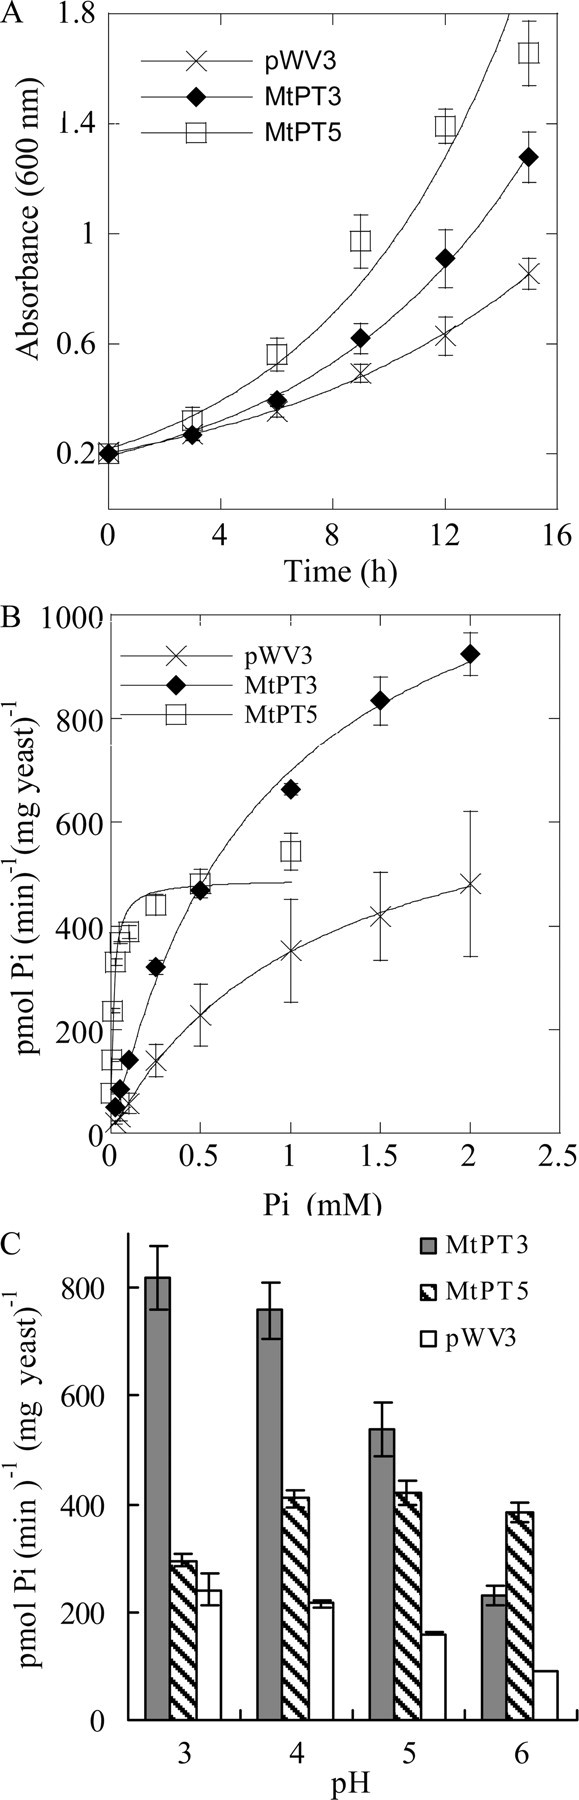
Phosphate transport properties of MtPT3 and MtPT5 in yeast. A, comparison of yeast growth rate. Yeast PAM2 cells expressing MtPT3, MtPT5, or the pWV3 vector control were grown in synthetic dextrose medium containing 0.22 mm Pi and 25 mm sodium citrate buffer at pH 4.5. A600 value was monitored as a measurement of growth. Values shown are the mean ± S.D. for three independent experiments. B, phosphate uptake rate as a function of external phosphate concentration. Phosphate uptake rates of yeast PAM2 cells carrying MtPT3, MtPT5, or the pWV3 vector control were measured at pH 4.0 with different external phosphate concentrations. Values are the means from two independent experiments ± S.D., each with duplicate samples. Lines are derived from nonlinear regression analysis. C, phosphate uptake rate as a function of external pH value. The phosphate uptake rate of yeast PAM2 cells expressing MtPT3 (gray bars), MtPT5 (cross-hatched bars), or carrying the pWV3 vector control (open bars) was determined at the indicated pH values. Values from one of three independent experiments are shown, mean ± S.D. for three time point replicates.