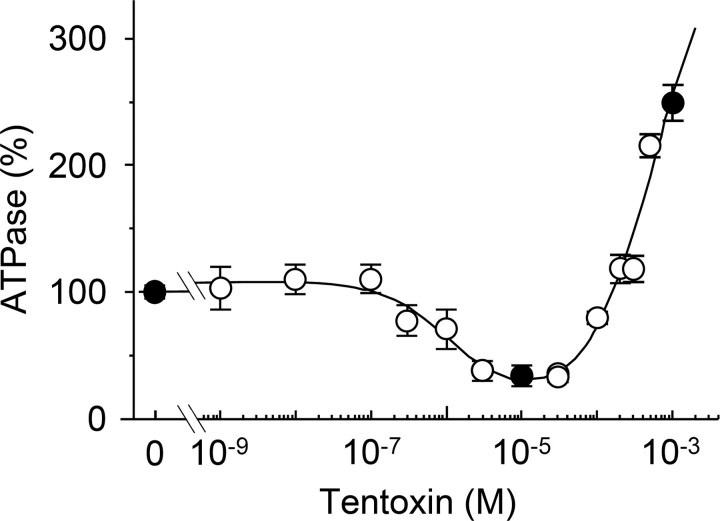
FIGURE 1.
Steady state ATP hydrolysis activity of the biotinylated α3β3γCys125/222 complex in the presence of tentoxin. ATP hydrolysis activity was measured with an ATP-regenerating system coupled to the oxidation of NADH. The samples were preincubated with the indicated toxin concentrations at 22 °C for at least 30 min, and tentoxin was also included in the reaction buffer. The reaction was measured at 25 °C for 5 min in the presence of 2 mm ATP and calculated relatively to the conditions without tentoxin (2.6 ± 0.2 μmol of Pi released per mg of protein/min), which was set as 100%. Black circles indicate the toxin concentrations used in our single molecule experiments. The curve shown in the figure was obtained by the least square analysis of the data using an equation proposed by Santolini et al. for the analysis of tentoxin binding (Equations 6–8 in Ref. 10). From this analysis, an apparent dissociation constant of 1.08 μm was obtained for tentoxin inhibition and of 565 μm for tentoxin stimulation.

