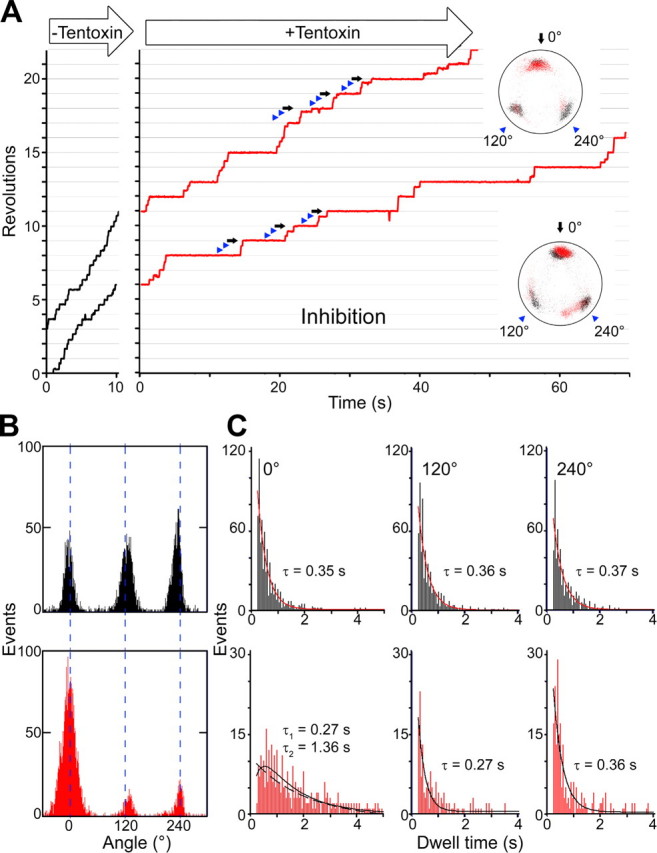
FIGURE 2.

Rotation under inhibitory concentrations of tentoxin. A, particles (diameter 210 nm) were observed at 250 nm ATP for 5 min. After solution exchange with buffer containing 10 μm tentoxin, the same particles were observed for a further 5 min. Insets show the trace of the bead centroid before (black dots) and after tentoxin infusion (red dots). Under inhibitory conditions, revolution was asymmetric with one long pause (black arrows) and two short pauses (blue arrowheads) per 360° turn. B, angle distribution of one rotating particle at 250 nm ATP before (black bars) and after (red bars) tentoxin infusion was analyzed. Change or shift of positions was as follows: -1.6 ± 10.7° at 0° (set arbitrarily for the most inhibited position), -0.6 ± 12.8° at 120°, and 0.5 ± 11.3° at 240°. C, dwell times at 0, 120, and 240° before (black bars) and after (red bars) tentoxin infusion are plotted and analyzed. Total number of pauses were 736 for 0°, 629 for 120°, and 603 for 240° before solution exchange and 342 for 0°, 219 for 120°, and 215 for 240° after solution exchange (data from nine particles were aligned at the most inhibited position, which was set as 0°). All dwell time distributions could be fitted with a single exponential decay, besides the 0° position after tentoxin infusion, which shows a double exponential decay with R = 0.81 (dashed line represent a single exponential decay with R = 0.78).
