FIGURE 3.
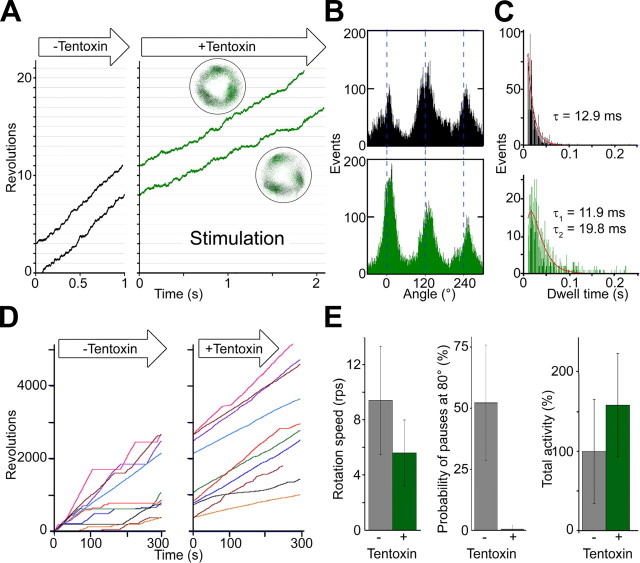
Rotation under stimulatory concentrations of tentoxin. A, close-up views of rotation observed at 20 μm ATP before (left part) and after buffer exchange with 1 mm tentoxin (right part) are indicated. Insets show the trace of the beads centroid before (black dots) and after tentoxin infusion (green dots). B, angle distribution of one rotating particle at 20 μm ATP before (black bars) and after (green bars) tentoxin infusion are indicated. C, dwell times before (black bars) and after (green bars) tentoxin infusion are plotted and analyzed. Total number of pauses was 1,070 before and 667 after solution exchange (data from three merged particles). Dwell time distribution before tentoxin infusion could be fitted with a single exponential decay. Stimulated particles show a double exponential decay. D, long term observation of F1 rotation with and without stimulatory tentoxin concentrations (1 mm) are indicated. Rotating particles were observed twice at 20 μm ATP for 5 min. Before tentoxin infusion, rotation of the beads often showed long pauses above 5 s at 80°. Stimulated particles show slower rotation speed but virtually no long pauses (>5 s), which lead to an increased net activity calculated as total revolutions per total observation time (summarized in E).

