Figure 6.
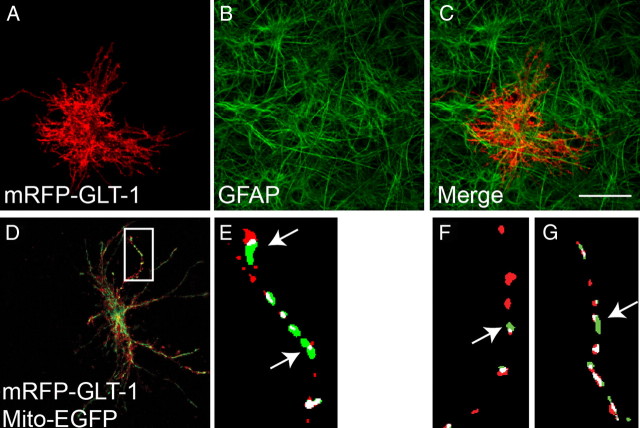
Colocalization of mitochondria and GLT-1 in the processes of astrocytes in hippocampal slice cultures. A–C, Representative images of astrocytes in slice culture transfected with the cDNA encoding mRFP-GLT-1 (A; red) and immunostained for glial fibrillary acidic protein (B; GFAP; green) and merged images (C) demonstrate that transfected cells express the astrocytic marker GFAP. GFAP does not, however, occupy a substantial portion of the astrocytic volume. Scale bar, 25 μm. D, Low-magnification view of an astrocyte in slice culture cotransfected with cDNAs encoding mRFP-GLT-1 (red) and Mito-EGFP (green). E–G, Binary, higher-magnification view (E) of the astrocyte process highlighted in D (white box) and from other astrocytes (F, G). Colocalized pixels are indicated in white. White arrows highlight areas where there is not complete overlap of GLT-1 with mitochondria.

