FIGURE 4.
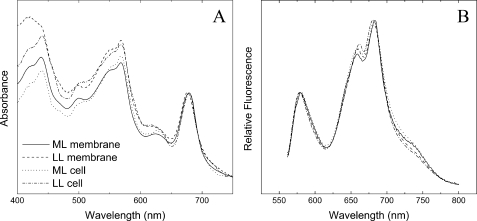
Spectral properties of whole cells and isolated PBsome-thylakoid membranes from P. cruentum grown under LL (6 watts·m-2) and ML (15 watts·m-2). A, absorption spectra. Spectra were normalized to the chlorophyll absorption band at 682 nm. It shows several partially resolved peaks, which are assigned to chlorophyll a (439 nm and 678 nm), carotenoids (490 nm), and PBsomes (500–650 nm); B, room temperature fluorescence spectrum. Excitation was at 545 nm. It shows three distinguishable fluorescence bands at 580, 660, and 680 nm. The 580 nm peak corresponds to the PE fraction of PBsomes. The 660 nm fluorescence emission components may come from the intact PBsomes. The fluorescence emission at 680 nm is attributed to mostly PSII and a small shoulder at 730 nm is from PSI, because PSI fluorescence emission is generally low at room temperature.

